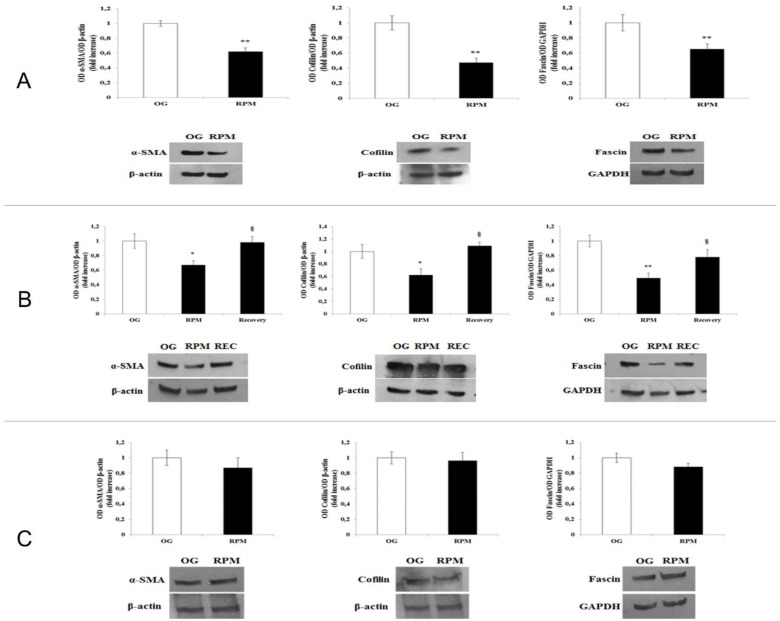
Figure 7.
Western blot analyses of α-SMA, Cofilin, and Fascin in human dermal fibroblasts exposed to simulated microgravity (RPM). Columns represent densitometric quantification of the optical density (OD) of a specific protein signal normalized with the OD values of the β-actin (α-SMA and Cofilin) and GAPHD (Fascin). Values are expressed as a fold increase of on-ground control (OG). Each column represents the mean value ± SD of three independent experiments, where SD is depicted as vertical bars. (A) Fibroblasts exposed to simulated weightlessness (RPM) and in normal gravity (OG) for 24 h. Each column represents the mean value ± SD of three independent experiments, where SD is depicted as vertical bars. ** p < 0.01 RPM versus OG by an unpaired two-tailed t-test. On the bottom, a panel of representative Western blot analyses is reported. (B) Same conditions as in A: cells are reseeded into normal gravity (recovery) for 24 h. ** p < 0.01 RPM versus OG; § p < 0.05 recovery versus RPM by ANOVA followed by Bonferroni post-test. (C). Western blot analyses of α-SMA, Cofilin and Fascin in human dermal fibroblasts exposed to simulated microgravity (RPM) for 72 h. Data were statistically analyzed with unpaired two-tailed t-test. No significant differences were recorded between on-ground and in-microgravity cultured cells after 72 h of µG. On the bottom, a panel of representative Western blot analyses is reported.

