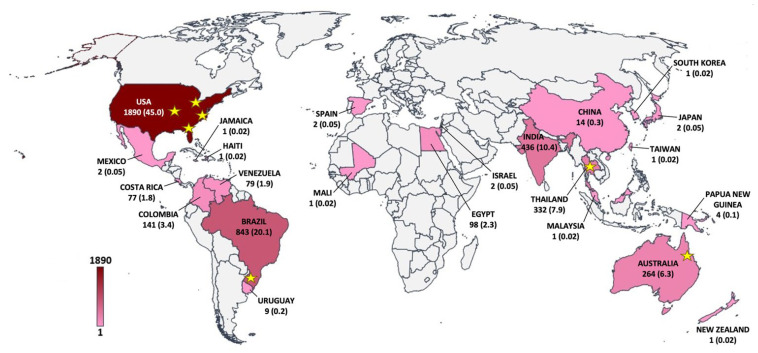
Figure 3.
The world map shows the geographic distribution of pythiosis in humans and animals. The case numbers and percentages (in the parenthesis) are added to the countries where the patients acquired pythiosis. The color scale represents case density (ranging from 1 to 1890 cases). Stars indicate the areas or countries where P. insidiosum has been successfully isolated from the environment.

