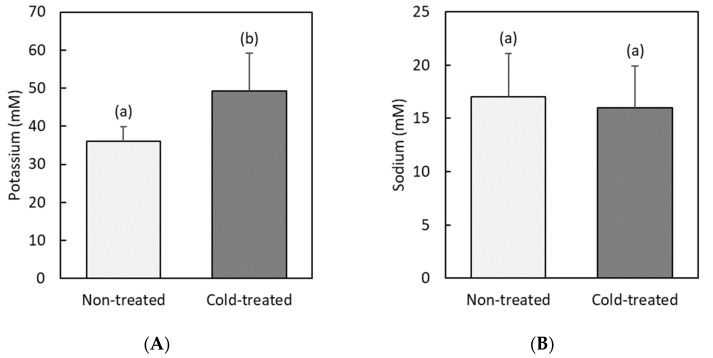
Figure 4.
Concentrations (mM) of: (A) Potassium and (B) Sodium in hemolymph from non-treated and cold-treated groups. Error bars indicate standard deviations (n = 14 non-treated and n = 14 cold-treated samples, each sample containing the hemolymph of 3–5 individuals from the same group). Statistically different (p < 0.05) concentrations are labelled with different letters (F = 11.3, df = 27, p = 0.003 for potassium and F = 0.3, df = 27, p = 0.06 for sodium).

