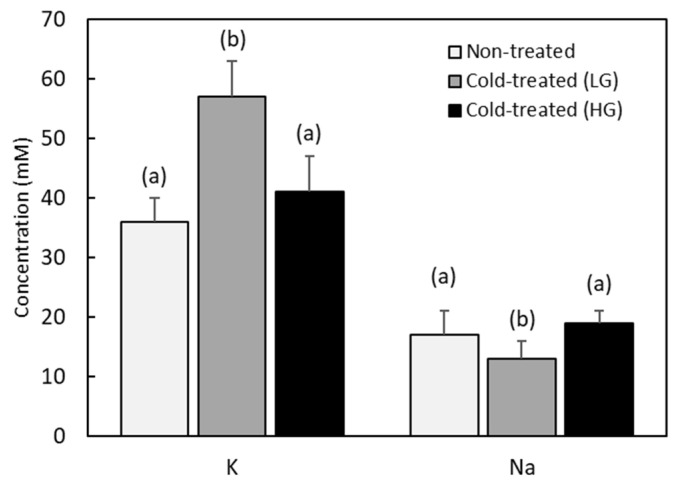
Figure 5.
Hemolymph potassium and sodium levels in non-treated animals (n = 14) and in low-glucose (n = 7) and high glucose (n = 7) subgroups of cold-treated larvae. Error bars indicate standard deviations. Statistically different (p < 0.05) distributions are labelled with different letters (F = 28.7, df = 20, p < 0.001, LSD = 5.9 for potassium and F = 6.7, df = 20, p = 0.007, LSD = 3.1 for sodium).

