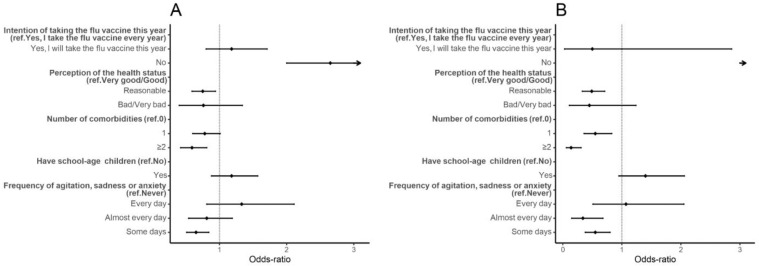
Figure 2.
Forest plot of vaccine hesitancy for individual influences. Adjusted odds-ratio (adjusted for gender, age, education, and period of questionnaire) and the respective 95% confidence intervals are denoted by black dots and black lines, respectively. Forest plot confidence intervals and estimates were cut off at 3. (A) Results of the main analysis—vaccinated vs. hesitant (refuse, undecided and would take the vaccine); (B) results for the sensitivity analysis, removing individuals who would take the vaccine.

