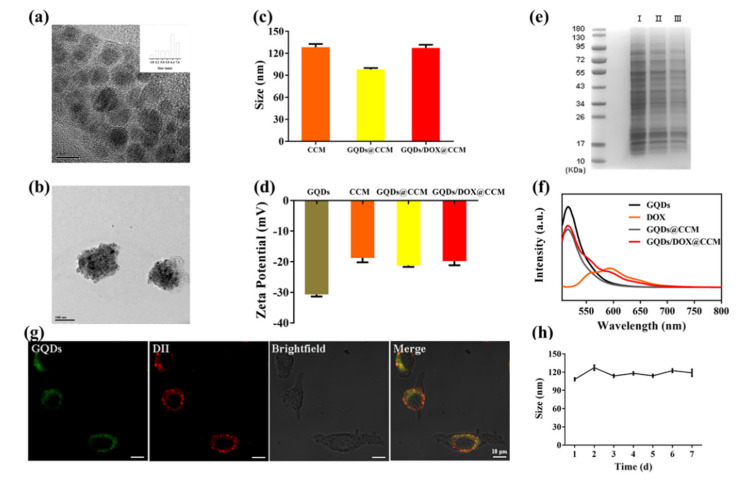
Figure 3.
Characterization of GQDs/DOX@CCM. (a) TEM image of GQDs. Scale bar = 5 nm. (b) TEM image of GQDs/DOX@CCM. Scale bar = 100 nm. (c) DLS analysis of CCM, GQDs@CCM, and GQDs/DOX@CCM. (d) Zeta potentials of GQDs, CCM, GQDs@CCM, and GQDs/DOX@CCM. (e) SDS-PAGE protein analysis of I CCM, II GQDs@CCM, and III GQDs/DOX@CCM. (f) PL spectra of GQDs, DOX, GQDs@CCM, and GQDs/DOX@CCM. (g) CLSM images of the GQDs@CCM illustrating the colocalization of the GQDs and CCM (DII channel). Scale bar = 10 μm. (h) Stability of GQDs/DOX@CCM in PBS (pH = 7.4) by measuring the particle size.

