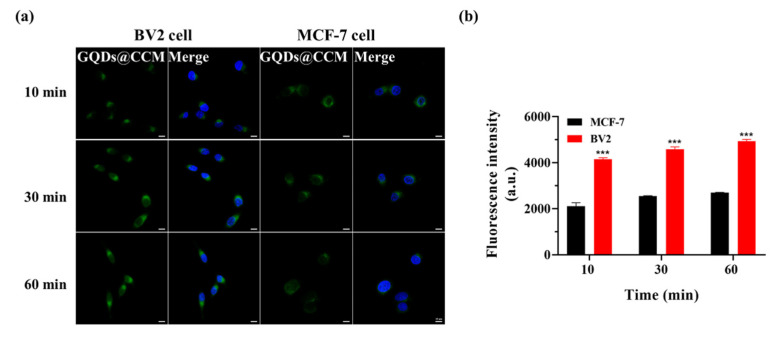
Figure 7.
Homologous targeting of GQDs@CCM. (a) CLSM images of BV2 and MCF-7 cells incubated with GQDs@CCM at a GQDs concentration of 200 μg/mL for different time periods. Scale bar = 10 μm. (b) Quantitative analysis of cell uptake by FCM in different time periods. The differences among groups were determined by a one-way ANOVA analysis followed by the Tukey’s post-test: *** p < 0.001.

