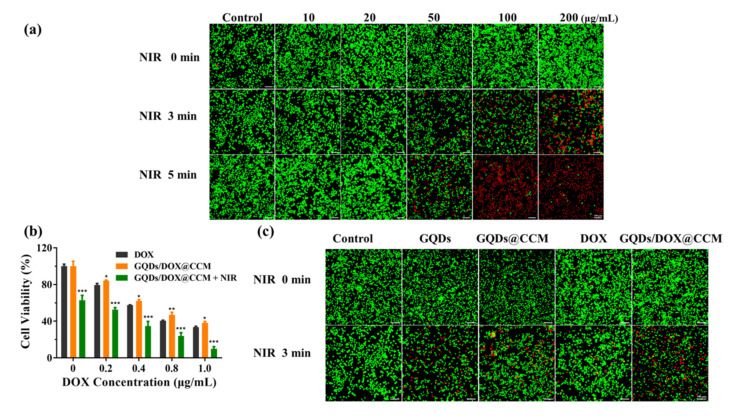
Figure 8.
Antitumor efficacy in vitro. (a) The cytotoxicity of BV2 cells treated with different concentrations of GQDs for 4 h with NIR laser irradiation (808 nm, 1.44 W/cm2). Scale bar = 10 μm. (b) Relative BV2 cells viability after treatment with different concentrations of DOX, GQDs/DOX@CCM, and GQDs/DOX@CCM (NIR) for 24 h. (c) Calcein-AM/PI cell staining of BV2 cells subjected to different treatments. Scale bar = 10 μm. The differences among groups were determined by a one-way ANOVA analysis followed by the Tukey’s post-test: * p <0.05, ** p <0.01, *** p < 0.001.

