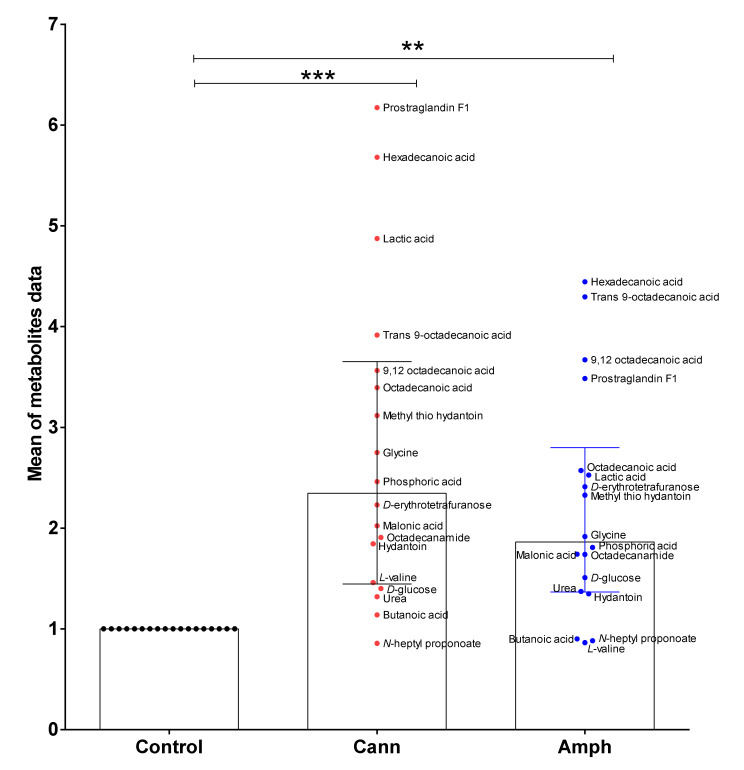
Figure 8.
Kruskal–Wallis test followed by Dunn’s post hoc analysis showed that the metabolomic profiles of amphetamine or cannabis use disorder patients are significantly different than control group. Data are expressed as median with interquartile range. (** p < 0.01, *** p < 0.001). Each dot represents mean of one metabolite in each group. Cann, cannabis. Amph, amphetamine.

