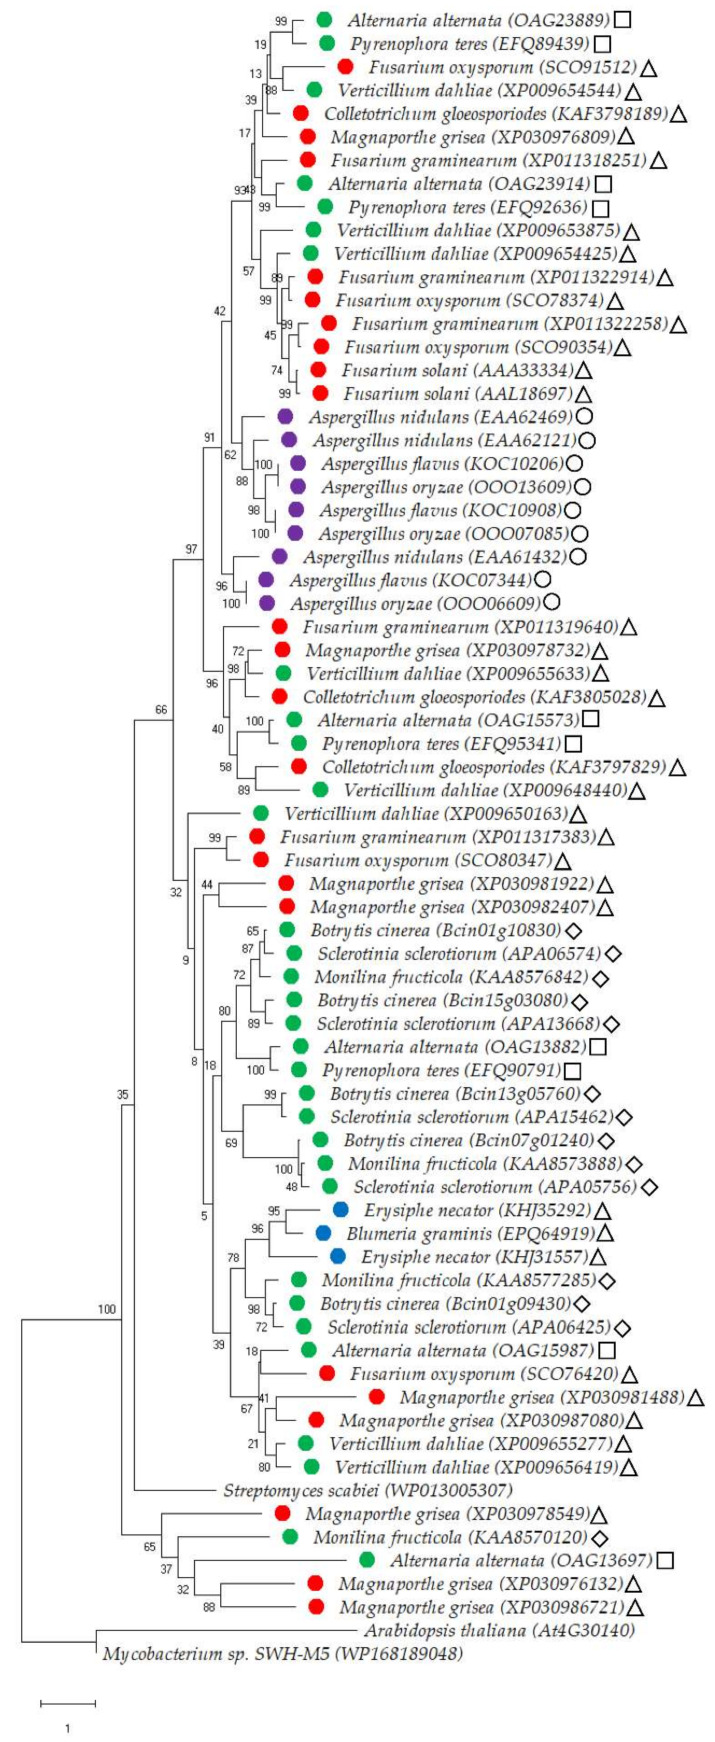
Figure 3.
Molecular phylogenetic tree of cutinases of fungal species with different lifestyles. The phylogenetic tree was inferred by using the Maximum Likelihood method and Whelan and Goldman + Freq. model [82]. Gamma distribution was used to model evolutionary rate differences among sites [five categories (+G, parameter = 1.1745)]. The tree with the highest log likelihood (−26,692.25) is shown. The percentage of trees in which the associated taxa clustered together is shown next to the branches following 1000 bootstrap replications. The tree is drawn to scale, with branch lengths measured in the number of substitutions per site. There was a total of 612 positions in the final dataset. Evolutionary analyses were conducted in MEGA X [83]. The analysis involved the full protein sequences of 68 characterised and/or putative cutinases belonging to fungal species with different lifestyles based on blast analysis against the well-characterised and structurally resolved Fusarium solani cutinase (AAL18697). All of these proteins exhibited >30% sequence identity vs. the Fusarium solani cutinase. The isolated proteins belong to 32 necrotrophic (●), 24 hemibiotrophic (●), three biotrophic (●), and nine saprotrophic (●) fungal species. In addition, cutinases from each fungal species are classified to the following Ascomycota classes: Sordariomycetes (∆), Dothideomycetes (◻), Leotiomycetes (♢), and Eurotiomycetes (ο). For outgroups, we have used the full protein sequences of cutinases isolated from Arabidopsis thaliana, Streptomyces scabiei and Mycobacterium spp. Protein IDs are given in parenthesis following the species name.

