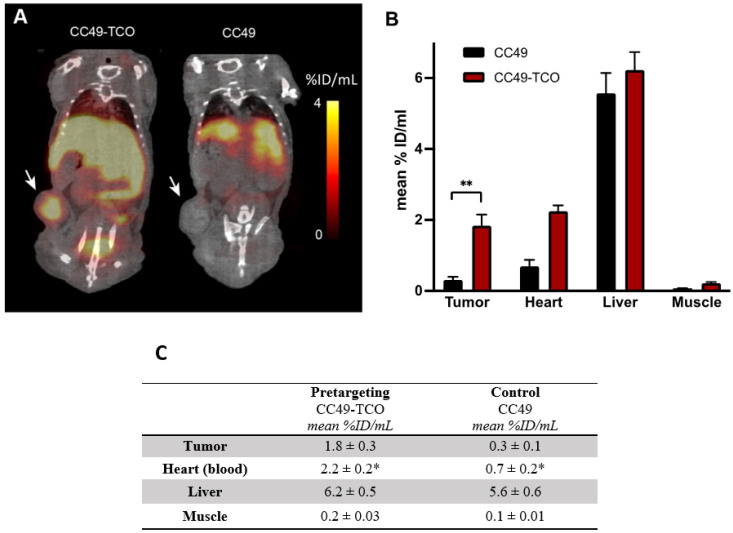
Figure 5.
PET/CT imaging of [18F]45. (A) Images from PET/CT scans of [18F]45 1 h p.i. from mice pretreated with either CC49-TCO (left) or CC49 (right) 72 h earlier. Scale bar indicates mean percent of injected dose per gram (%ID/mL). White arrows indicate LS174T tumor xenografts. (B) Image-derived tissue uptake (mean %ID/mL) of [18F]45 1 h p.i. in mice administered with either CC49-TCO or CC49 72 h prior to [18F]45 injection. (C) Image-derived tissue uptake of [18F]45 in mean %ID/mL. All values are reported as mean ± S.E.M, n = 5/group. * Uptake in heart was considered as a surrogate for blood. ** p < 0.01 (Welch’s t-test).

