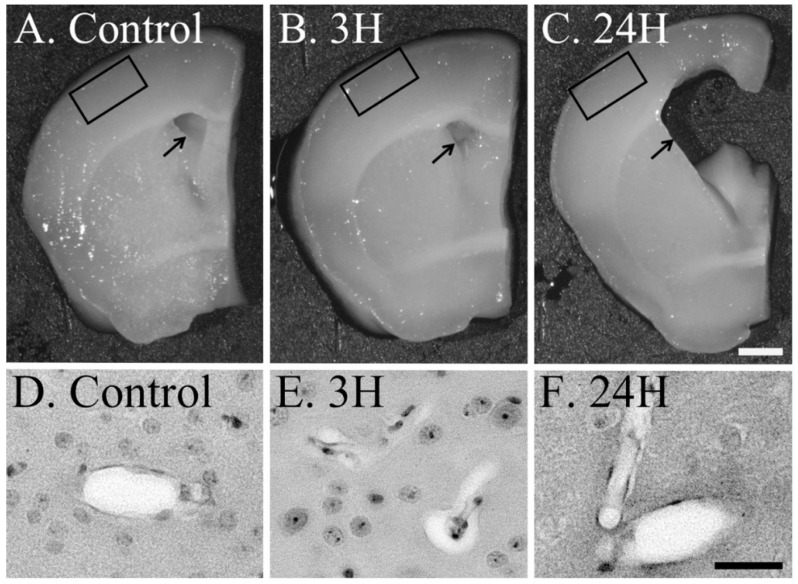
Figure 2.
Control (A), 3H (B) and 24H (C) representative images of the brain tissues from the vehicle control animals (at 3 h) and those from animals sacrificed at 3 h and 24 h after ammonia treatment, respectively. Control (D), 3H (E) and 24H (F) illustrate the perivascular edema of the cerebral cortex layer II/III (each black square in A through C). Arrows indicate the position of the lateral ventricle and the scale bars in C and F = 1 mm and 200 μm, respectively.

