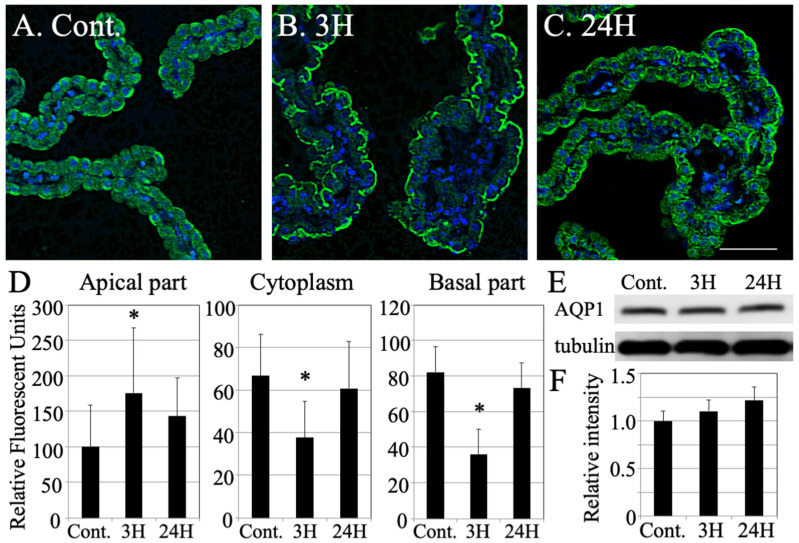
Figure 5.
Changes in the distribution and expression of AQP1 in choroid plexus tissues following hepatic encephalopathy. (A–C) Immunohistochemical staining for aquaporin-1 (green color) and DAPI stained nucleus (blue color) in each animal (each n = 3). (D) Relative intensity of aquaporin-1 (green color) in the apical portion of the choroid plexus, cytoplasm of the choroid plexus and basal part of the choroid plexus as determined using densitometry. Data are expressed as mean ± standard error. All data are shown as the relative intensity (100 = the intensity of the apical section in the control). (E) Western blot revealing the timing of aquaporin-1 expression. (F) Densitometry analysis of the Western blot data (each number = 3). Data are expressed as mean ± standard error. Data are shown as the relative intensity (100 = the intensity of control value). Cont., 3H and 24H represent the various treatment groups, as previously described. *: p < 0.05 compared with the control.

