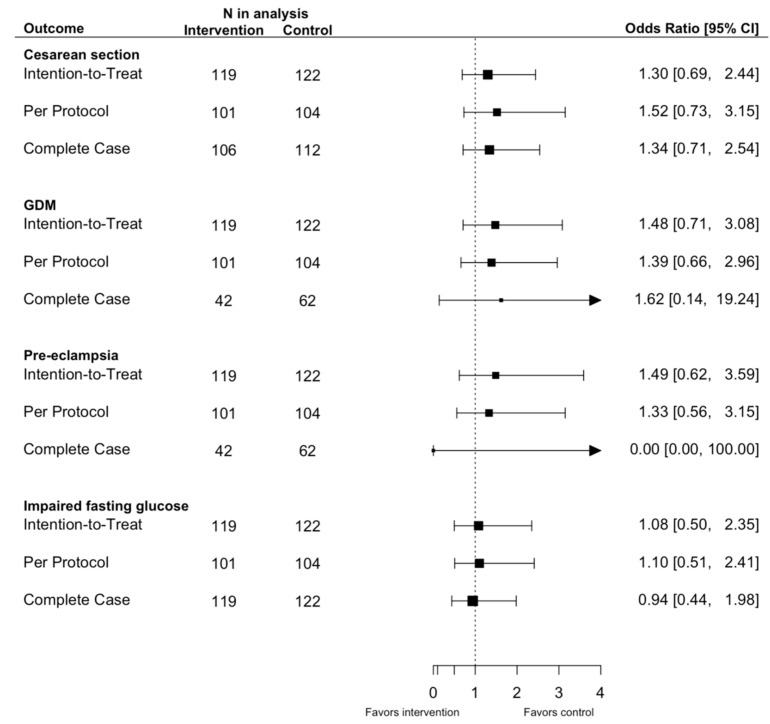
Figure 3.
Forest plots of intervention effect for binary pre-specified pregnancy outcomes by intention-to-treat, per protocol, and complete case analysis adjusted for study site and maternal pre-pregnancy BMI category. OR = odds ratio; CI = confidence interval All analyses adjusted for site (Hamilton, London) and pre-pregnancy BMI (preBMI) categories: underweight to normal weight (≤24.9), overweight (25.0–29.9), obese (≥30). Due to a very low number of events, adjusted regression analyses could not be performed on operative vaginal delivery.

