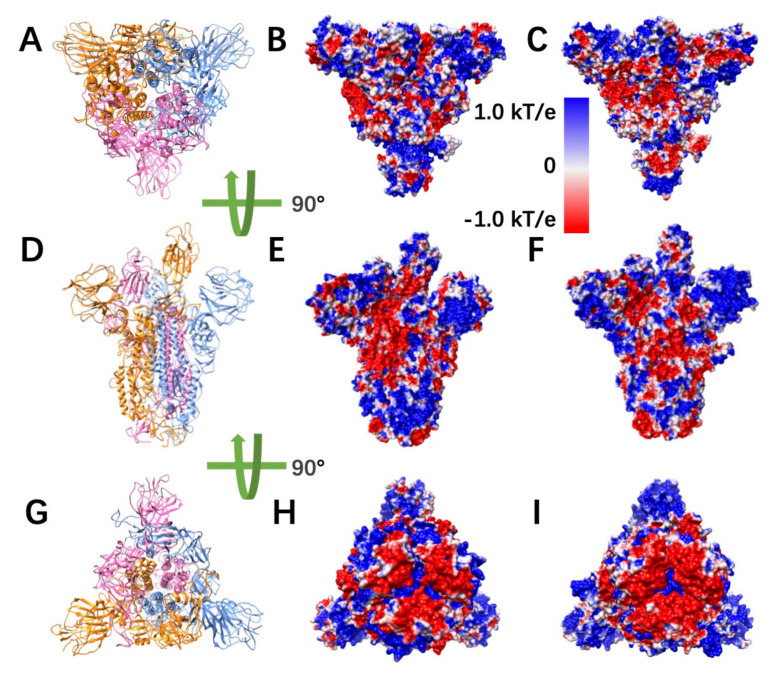
Figure 2.
Electrostatic potential on surfaces of SARS-CoV and SARS-CoV-2 S proteins. (A) Top view of S protein structure; (B,C) top views of electrostatic potential on surfaces of SARS-CoV and SARS-CoV-2 S protein, respectively; (D) front view of S protein structure; (E,F) front views of electrostatic potential on surfaces of SARS-CoV and SARS-CoV-2 S protein, respectively; (G) bottom view of S protein structure; (H,I) bottom views of electrostatic potential on surfaces of SARS-CoV and SARS-CoV-2 S protein, respectively. Negatively and positively charged areas are colored in red and blue, respectively, with the color scale from −1.0 to 1.0 kT/e.

