Figure 9.
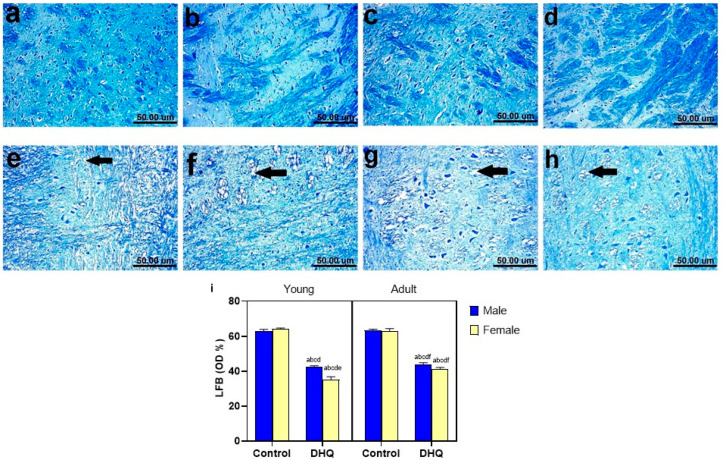
Histological Luxol fast blue-stained sections from striatum of (a–d) control rats, (a) young male, (b) young female, (c) adult male, and (d) adult female, showing apparently normal dark blue myelinated axons. (e–h) showing demyelination (black arrow), (e) DHQ young male, (f) DHQ young female, (g) DHQ adult male, and (h) DHQ adult female. (Scale bar 50 um). (i) Quantitative analysis of LFB staining in striatal sections. Each bar with a vertical line represents the mean ± S.D. of 5 rats per group (5 fields/rat). a vs. control young male, b vs. control young female, c vs. control adult male, d vs. control adult female, e vs. DHQ young male, and f vs. DHQ young female, using three-way ANOVA followed by Tukey’s post hoc test; p < 0.05. DHQ; diiodohydroxyquinoline.

