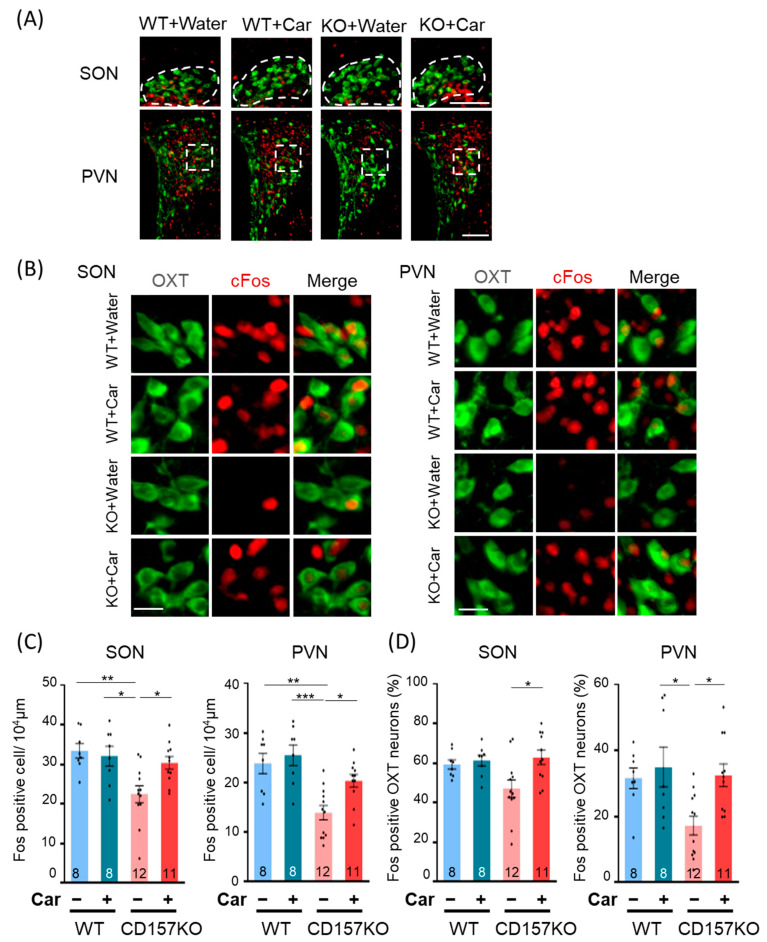
Figure 2.
Induction of c-Fos in the supraoptic nucleus (SON) and paraventricular nucleus (PVN) of the hypothalamus after social recognition tests. (A) Representative merged immunostaining images of oxytocin (OT) (green) and c-Fos (red) in the SON and PVN in low magnification. The dotted areas are used for counting. Scale bars, 100 μm. (B) Representative immunostaining images of OT (green, left), c-Fos (red, middle) and merge (right) in high magnification. Scale bars, 20 μm. (C) The number of c-Fos-positive cells in the SON and PVN. (D) The percentage of c-Fos-expressing OT neurons. The percentages represent the number of c-Fos-positive OT neurons over the total number of OT neurons. The number of mice used for quantification in each group is indicated in the graph. Data are presented as the mean ± SEM. * p < 0.05, ** p < 0.01, *** p < 0.001. WT: wild-type, Car: L-carnosine.

