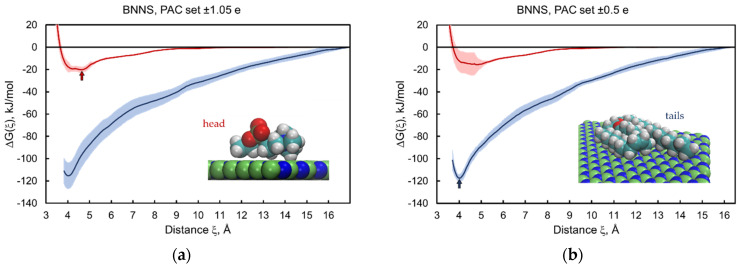
Figure 5.
Free energy change profiles for adsorption–desorption of the head (red) and tail (blue) parts of the POPC lipid on boron nitride nanosheets. Results obtained for two sets of partial atomic charges: PAC-I ± 1.05 e (a) and PAC-II ± 0.5 e (b). Color code: boron (green), nitrogen (blue); other colors are the same as in Figure 3. Alternative views of the lipid tail part in the adsorbed state are depicted in Supplementary Figure S2.

