Figure 1.
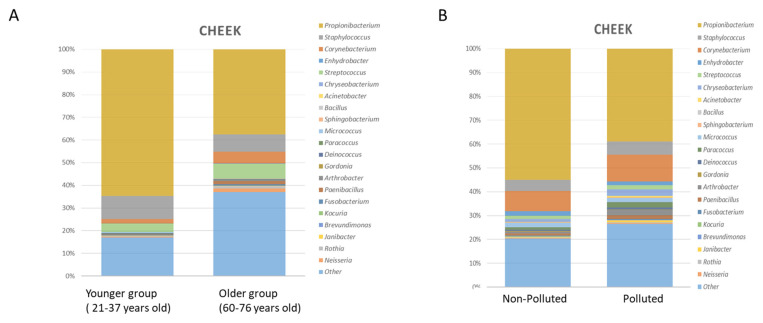
(A) Taxonomic analysis of cheek microbiome in younger and older subject’s group. Stacked bar charts showing the relative abundance of the 20 most prevalent bacterial genera. Adapted from [56] (B) Taxonomic analysis of cheek microbiome (younger group) in polluted and non-polluted environment. Stacked bar charts showing the relative abundance of the 20 most prevalent bacterial genera. Adapted from [57].

