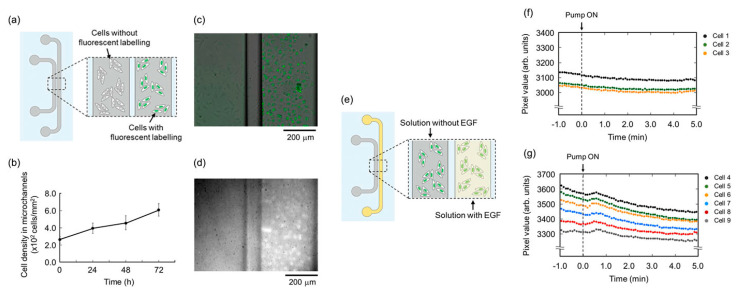
Figure 14.
Panel (a) represents the cells in the microfluidic channels and panel (b) represents the number of cells in the microchannels as a function of time. Demonstration of lens-free on chip fluorescence imaging HeLa cells seeded on collagen treated microchannels, panels (c,d). Panel (e) is a schematic of EGF delivered to the microchannels, panel (f,g) are the time course to detected fluorescence of the cells being imaged. Reproduced from [122] under Creative Commons Attribution 4.0 License.

