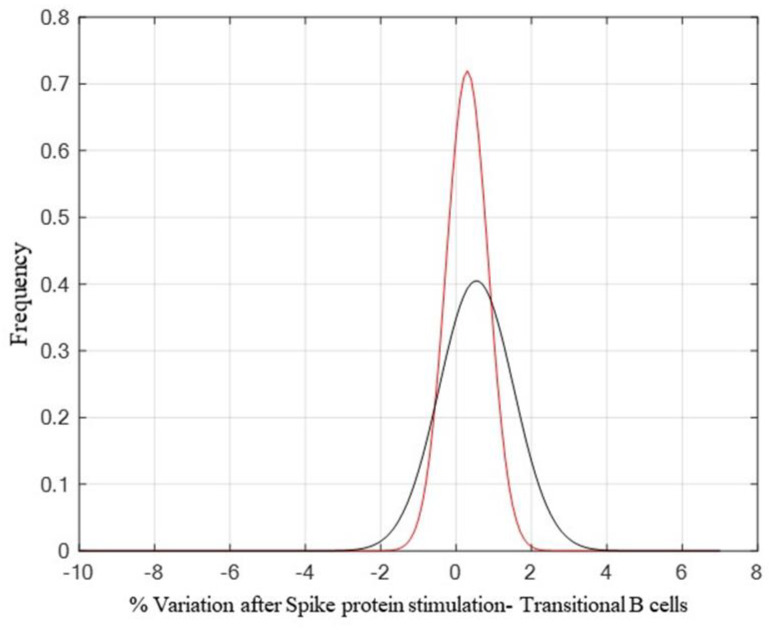
Figure 6.
A comparison between the control probability density function (pdf) (p = 0.4170 and h0 = 0), shown in red, and the high responder population pdf (p = 0.7146 and h0 = 0), shown in black, highlights a small increase after antigen stimulation of transitional B-cells. Tests for the verification of pdf adherence have been conducted through the Chi2 square method.

