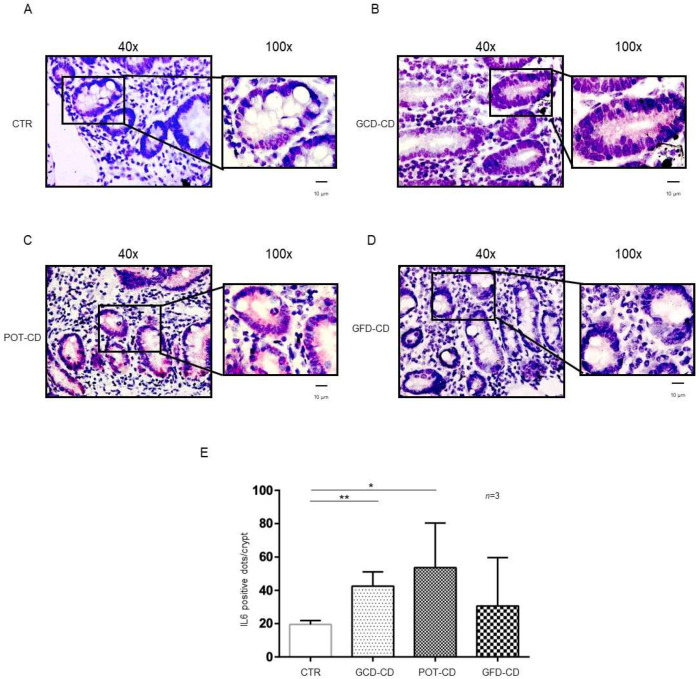
Figure 2.
IL-6 levels were increased in the epithelium of the crypts in CD biopsies: In situ mRNA analysis of IL-6 in biopsies from controls (CTR) (A), gluten-containing diet celiac disease patients (GCD-CD) (B), Potential CD patients (Pot-CD) (C), and gluten-free diet celiac patients (GFD-CD) (D). Blue indicates hematoxylin–eosin staining of the nuclei, and red indicates IL-6 mRNA. Black squares show different enlargements of crypts. Lines indicate 10 micrometers at 100× objective. (E). IL-6-positive red dot counts in the crypts of intestinal biopsies from CD patients and controls. At least 10 crypts/subject were counted on different slides. The numbers of subjects analyzed are indicated. Columns represent the mean, and bars represent the standard deviation. Student’s t test: * = p < 0.05; ** = p < 0.01.

