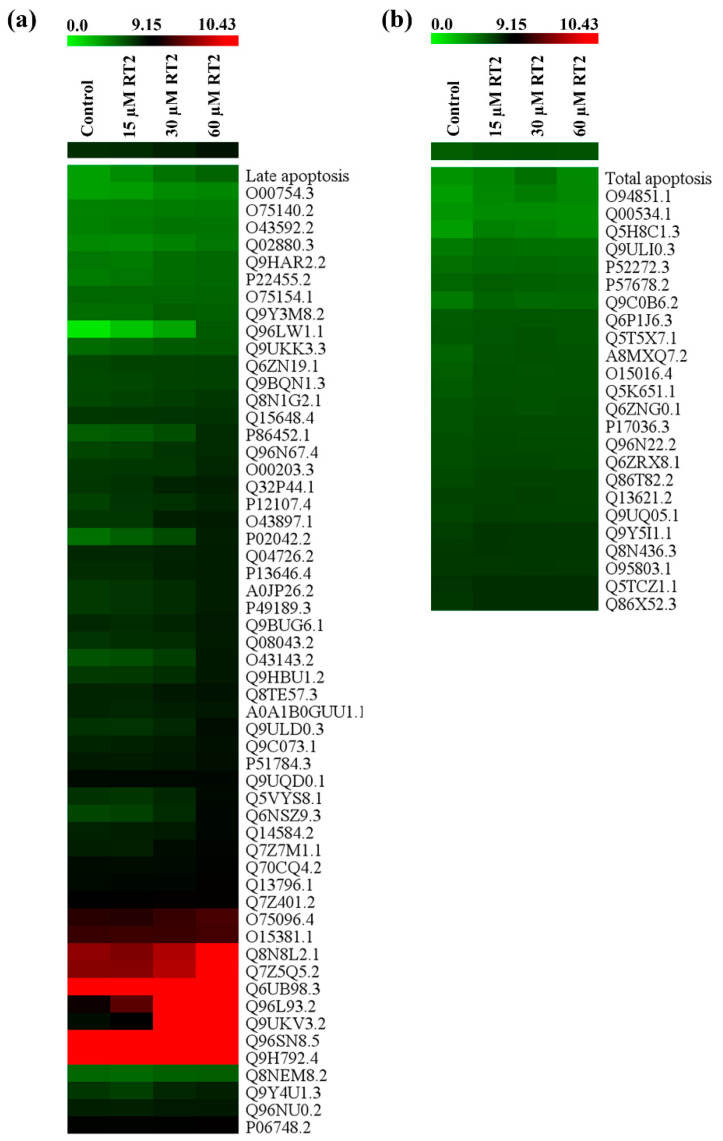
Figure 6.
Heatmap representation of the expression levels of (a) 55 proteins that are enhanced in Caco-2 cells in a comparable way to late apoptosis levels and (b) 24 proteins that are enhanced in Caco-2 cells in a comparable way to total apoptosis levels after RT2 treatment (15, 30, and 60 µM) as analyzed by SOTA. Note that the control corresponds to untreated cells. The relative protein expression values are color coded from the lowest (green) to the highest (red).

