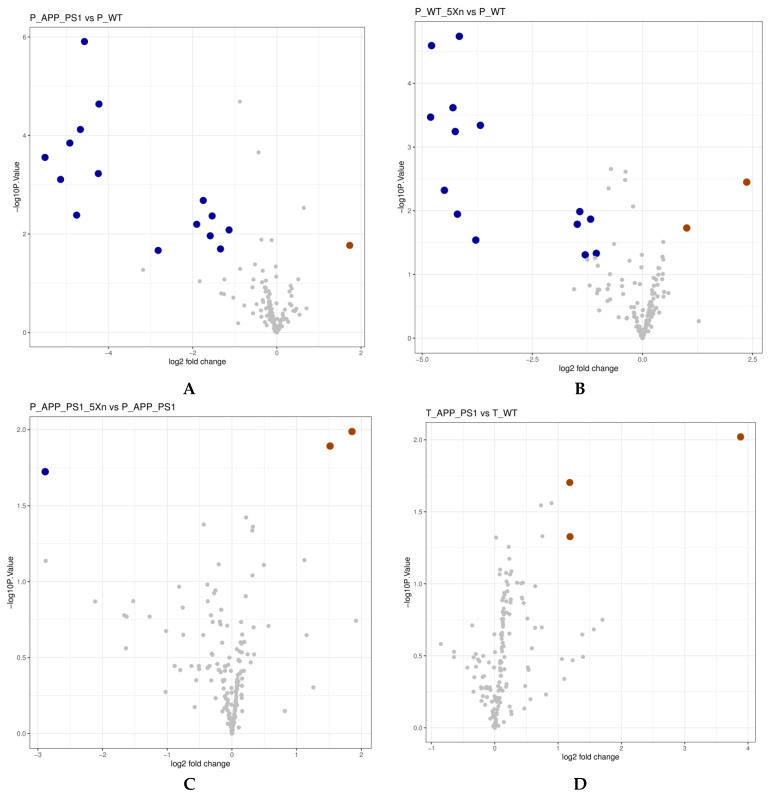
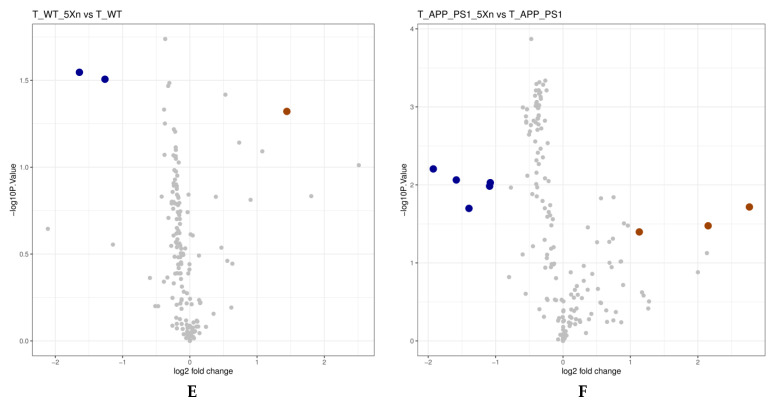
Figure 5.
KEGG pathway volcano to predict differences in metabolic pathways of microbial communities. (A–C) KEGG pathway volcano in the prevention experiment. (D–F) KEGG pathway volcano in the therapy experiment. The X-axis represents log2 fold change, the Y-axis represents −log10 (p value). Here, the log2 fold change with difference multiple greater than 2 and p value less than 0.05 were the screening conditions. Each of these big blue dots represents a down-regulated metabolic pathway while the big purple dots represent the up-regulated metabolic pathways.


