Figure 1.
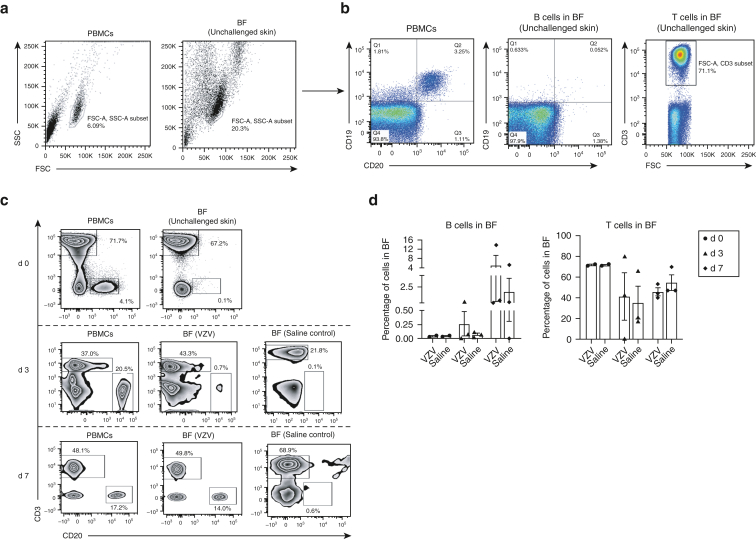
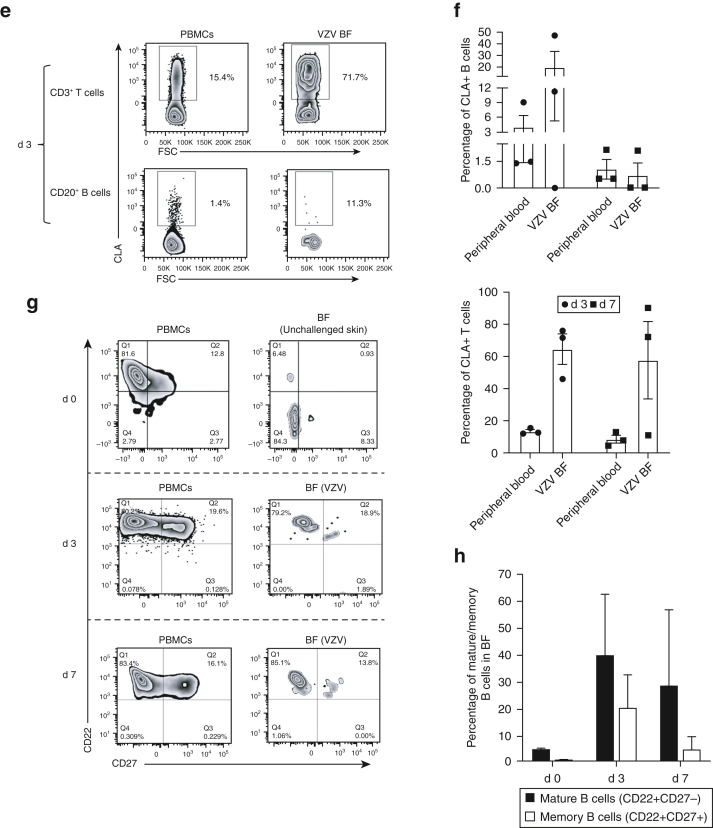
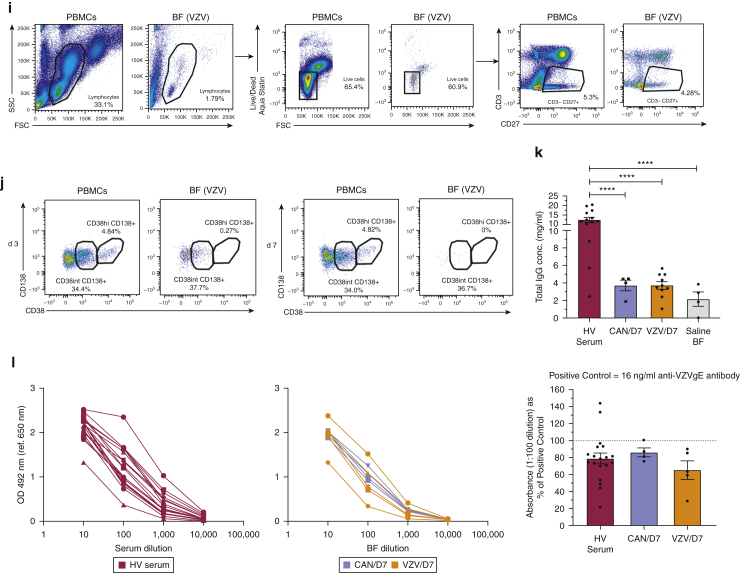
Characterization of skin-resident B cells with and without VZV antigen challenge. Suction blisters were induced (without VZV antigen challenge) on the skin of healthy individuals (n = 3), and BF was collected within 24 hours after blister formation for flow cytometric (FACS) analysis. Matched donor PBMCs were also analyzed by FACS. (a) Lymphocytes were identified on the basis of SSC and FSC profiles in peripheral blood and skin suction blisters. (b) Proportions of CD19+CD20+ B cells and CD3+ T cells were evaluated from the total lymphocyte population within donor PBMCs (n = 3; percentage mean ± SEM; B cells = 3.6 ± 0.3; T cells = 62 ± 19) and unchallenged BF (n = 3; percentage mean ± SEM; B cells = 0.05 ± 0.01; T cells = 53 ± 16). Representative FACS plot shown for an individual donor. (c) Donors received intradermal injections of VZV antigen or sterile saline, and blisters were raised over injection sites. Blister aspirates and matched donor PBMCs collected either 3 d (n = 3) or 7 d (n = 3) after injection were analyzed by FACS for B (CD20+) and T (CD3+) cells. Blisters on d 0 (n = 2) were induced without previous VZV challenge. Representative FACS plot shown for an individual donor. (d) Quantification of B and T cells within d 3 (n = 3) and d 7 (n = 3) VZV and saline blister aspirates compared with those within d 0 (n = 2) blisters. (e) d 3 blister aspirates and PBMCs analyzed by FACS for expression of CLA (a skin-homing marker) on CD20+ B cells and CD3+ T cells. Plots represent an individual donor. (f) Quantification of CLA+ B and T cells within d 3 (n = 3) and d 7 (n = 3) VZV blister aspirates and matched donor PBMCs. (g–h) Phenotypic analysis and quantification of mature (CD20+CD22+) and memory (CD20+CD27+) B cells within d 0 (n = 2) donor PBMCs and blister aspirates (non-VZV), compared with those within d 3 (n = 3) and d 7 (n = 3) donor PBMCs and VZV aspirates. Representative flow cytometry plots are shown. Kruskal‒Wallis test with Dunn’s multiple comparisons post-test was used for analysis. Error bars represent mean ± SEM. (i) Live lymphocytes were identified within peripheral blood and BF on the basis of SSC and FSC profiles and by staining with a live/dead (viability) marker, followed by identification of CD3–CD27+ lymphocytes. (j) Identification of plasma cell (CD38hiCD138+) and plasmablast (CD38intCD138+) subsets from within CD3–CD27+ B cells in peripheral blood and BF. FACS plots are shown for one individual each evaluated on d 3 and d 7. (k) Total IgG antibody titres within d 7 BF aspirates from saline- (control, n = 4), VZV- (n = 10), and CAN- (n = 4) challenged skin and from donor sera (n = 13) were analyzed using the ImmunoCAP and Total IgG ELISA assays. Each symbol on the plot represents one individual. ∗∗∗∗P < 0.0001. One-way ANOVA with Tukey’s multiple comparison post-test was used for analysis. (l) Reactivity of d 7 BF (CAN and VZV) and HV serum IgG to VZV antigen were tested using a modified indirect ELISA assay. Specific signal (optical density) was measured at 1:10, 1:100, 1:1,000, and 1:10,000 dilutions (left hand graphs). Antibody reactivity was then determined as absorbance at 1:100 dilution, relative to a positive control antibody (16 ng/ml anti-VZVgE) for each sample tested (right-hand graph). Error bars represent mean ± SEM. BF, blister fluid; CAN, candida; CLA, cutaneous lymphocyte antigen; conc, concentration; d, day; FSC, forward scatter; FSC-A, forward scatter area; HV, healthy volunteer; K, thousand; SSC, side scatter; SSC-A, side scatter area; VZV, varicella-zoster virus.


