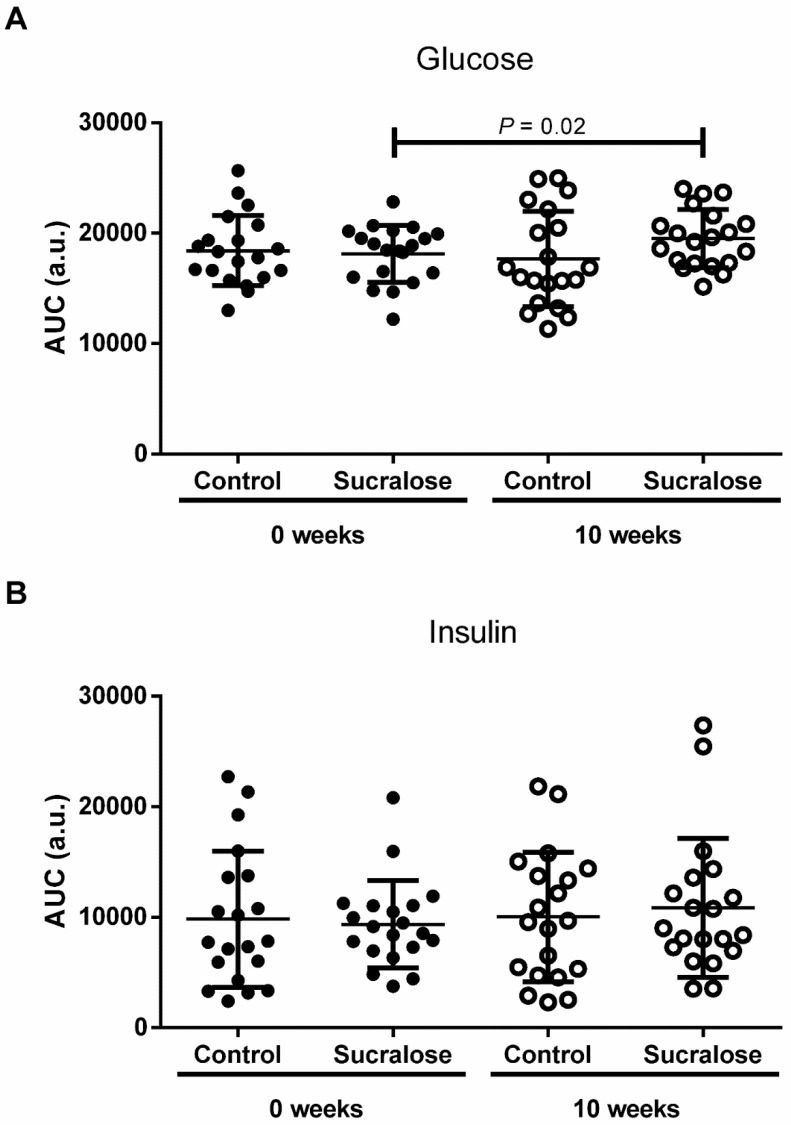
Figure 3.
The area under the curve of glucose and insulin during the oral glucose tolerance test. (A) At the beginning and end of the study, there were no differences between control and sucralose groups for the AUC of glucose (AUCG). Volunteers drinking sucralose for ten weeks exhibited a higher AUCG than was found at the study’s commencement. (B) At the beginning and end of the study, there were no differences between control and sucralose groups for the AUC of insulin (AUCI). Volunteers drinking water or sucralose for ten weeks exhibited similar AUCIs to those found at the beginning of the study. We show control and sucralose groups at 0 weeks in closed circles, whereas both groups are shown in open circles at ten weeks. We express data as mean ± standard deviation. Depending on the group comparison, we estimated significant differences from the paired Student’s T-test or the unpaired Student’s T-test. We considered a difference as significant when p < 0.05. Area under the curve (AUC); arbitrary units (a.u.).

