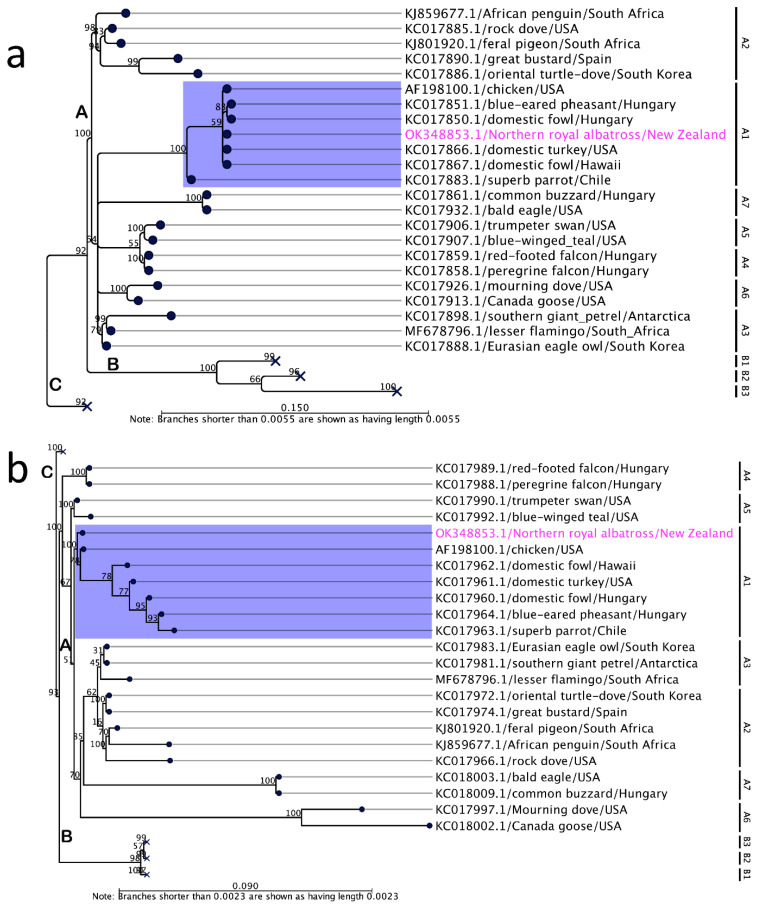
Figure 4.
Maximum likelihood (ML) phylogenetic tree from partial nucleotide sequences of the DNA polymerase gene (a) and P4b gene (b) of selected avipoxviruses. Labels at branch tips refer to GenBank accession number/species/country of origin. The numbers on the left show bootstrap values as percentages. The relevant sub-clade A1 is highlighted using blue shading, whilst the position of ALPV2 is highlighted using pink text. The ML tree is displayed as a phylogram. The bootstrap value assigned to a node in the output tree is the percentage (0–100) of the bootstrap resamples which resulted in a tree containing the same subtree as that rooted at the node. Major clades and sub-clades are designated according to Gyuranecz et al. (2013) [59]. Major clades B and C in both the trees (a) and (b) are collapsed. For the complete ML phylograms, please see Supplementary Figures S1 and S2.

