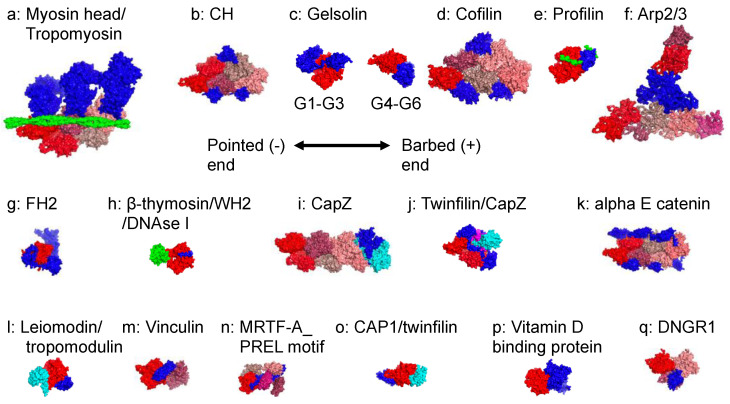
Figure 3.
Surface models of the actin–ABP complexes: (a) Myosin motor domain (Cardiac myosin, 7JH7, tropomyosin is shown in green [47]). (b) CH domain (Utrophin, CH1, 6M5G [54]). (c) Gelsolin domain (gelsolin G1_G3, 1RGI [78], G4_G6, 1H1V, [79]). (d) Cofilin (5YU8 [57]). (e) Profilin (profilin, 2PBD [58], VASP is shown in green). (f) Actin-related protein (Arp2/3/actin, 7AQK, [60]). (g) Formin homology 2 (FH2) domain (Yeast Bni1p/actin, 1Y64 [62]). (h) β-Thymosin/WH2 domain (Wiskott–Aldrich syndrome protein (WASP), 2A3Z [64], DNAse I is shown in green). (i) Capping protein (CapZ, 7PDZ [65], CapZ alpha-1 is shown in cyan; CapZ beta is shown in blue). (j) Twinfilin and CapZ (7CCC [66], CapZ alpha-1 is shown in cyan; CapZ beta is shown in magenta). (k) Alpha E catenin (6WVT [67]). (l) Leiomodin and tropomodulin (4Z94 [68], leiomodin is shown in blue; tropomodulin is shown in cyan). (m) Vinculin (3JBI [70]). (n) MRTF-A PREL motif (2YJF [71]). (o) Cyclase-associated protein CAP1 and cofilin (6RSW [72], CAP1 is indicated in blue; twinfilin is indicated in cyan). (p) Vitamin D binding protein (1MA9 [73]). (q) DNGR1 (3J82 [74]). Actin in F-actin is shown from pointed (left) to barbed (right) end with red, tv red, raspberry, dark salmon, salmon, deep salmon, warm pink, and firebrick. ABPs are shown in blue. DNAse I is shown in green.

