Figure 1.
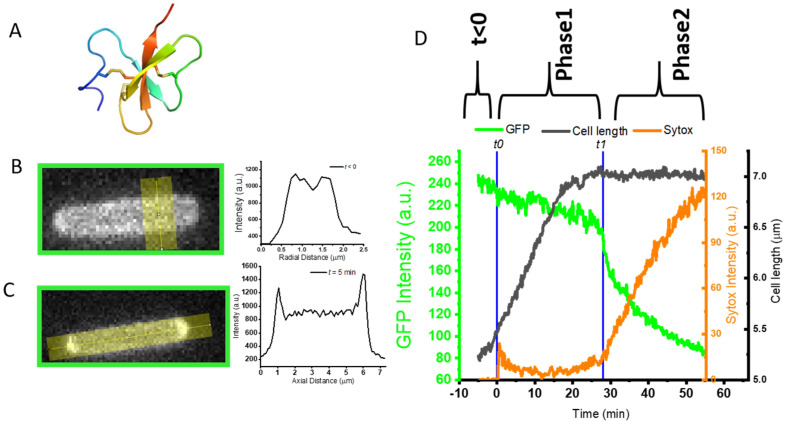
Effects of 2 μM of L-AvBD103b on a representative E.coli JCW10 strain expressing periplasmic GFP. (A) Schematic representation of the 3D NMR structure of L-AvBD103b [28]; PDB code 1ut3; backbone rainbow colored from N-ter in blue to C-ter in red; disulfide bridges in yellow; (B) At time < 0, typical fluorescence halo and typical double-peaked transverse intensity profile along the yellow line, indicating that most of GFP is in the periplasmic space before adding peptide; (C) During Phase 1, typical bright transient area of green fluorescence at end caps of E. coli, indicating the formation of transient periplasmic bubbles, for this specific bacteria from t = 2.4 min to t = 8 min; (D) Time dependence of total GFP intensity (in green, arbitrary units), of total Sytox intensity (in orange, arbitrary units) and of cell length (in black, in μm, calculated from phase contrast image). The flow of peptide begins at t = 0. Abrupt transition at time t1 (28 min for this example) is highlighted in blue.

