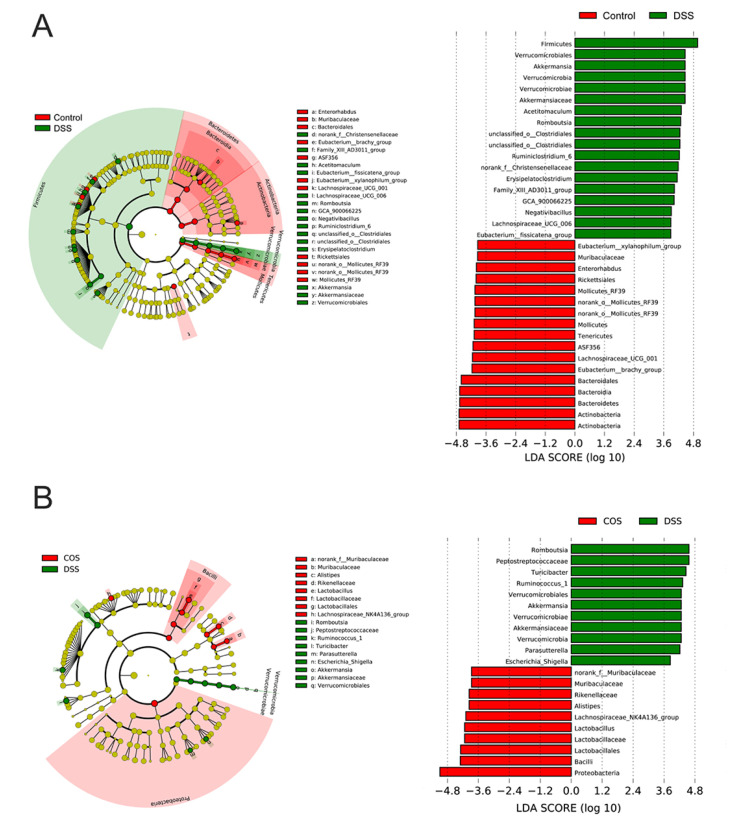
Figure 7.
Cladogram showing the polygenetic distribution of the bacterial lineages associated with different groups. (A) LEfSe analysis between control and DSS groups. (B) LEfSe analysis between DSS and COS groups. LEfSe provided the features that are differential bacterial taxa ranking according to the effect size. Different color nodes represent the microbial groups that are significantly enriched in corresponding groups and have a significant influence on the differences between groups (Control group (red) and DSS group (green) in Figure 7A; COS group (red) and DSS group (green) in Figure 7B). The light-yellow node indicates the microbial groups that have no significant difference in different groups or have no significant influence on the differences between groups. Only the taxa with an LDA score higher than 3.5 were shown.

