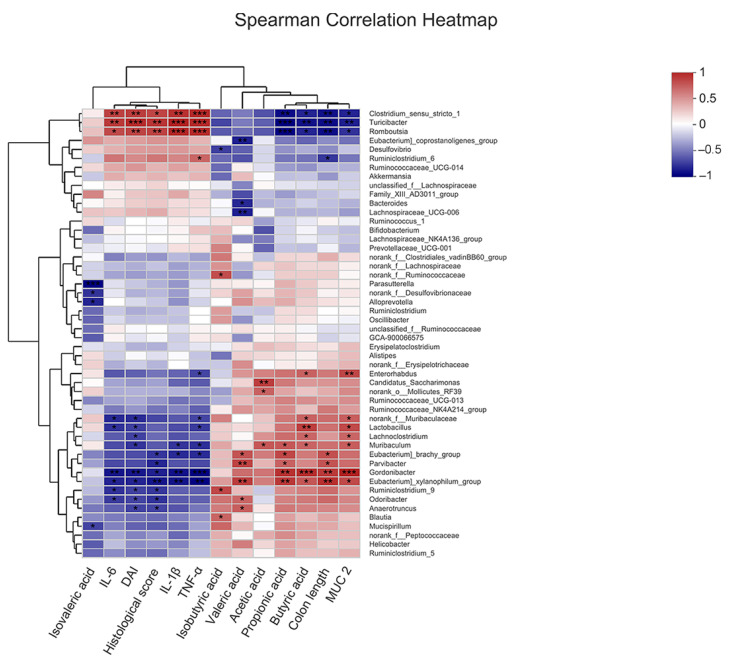
Figure 10.
Spearman analysis of the correlation of microbiota at the genus level with intestinal injury, intestinal barrier, inflammatory cytokine levels and SCFA levels. The top 50 most abundant genera in each sample were used for the hierarchical clustering and heatmap analyses based on the Spearman correlation coefficient. The red and blue blocks represent the positive and negative correlations, respectively, and the color grade shows the correlation degree. *, p < 0.05, **, p < 0.01, ***, p < 0.001, n = 4.

