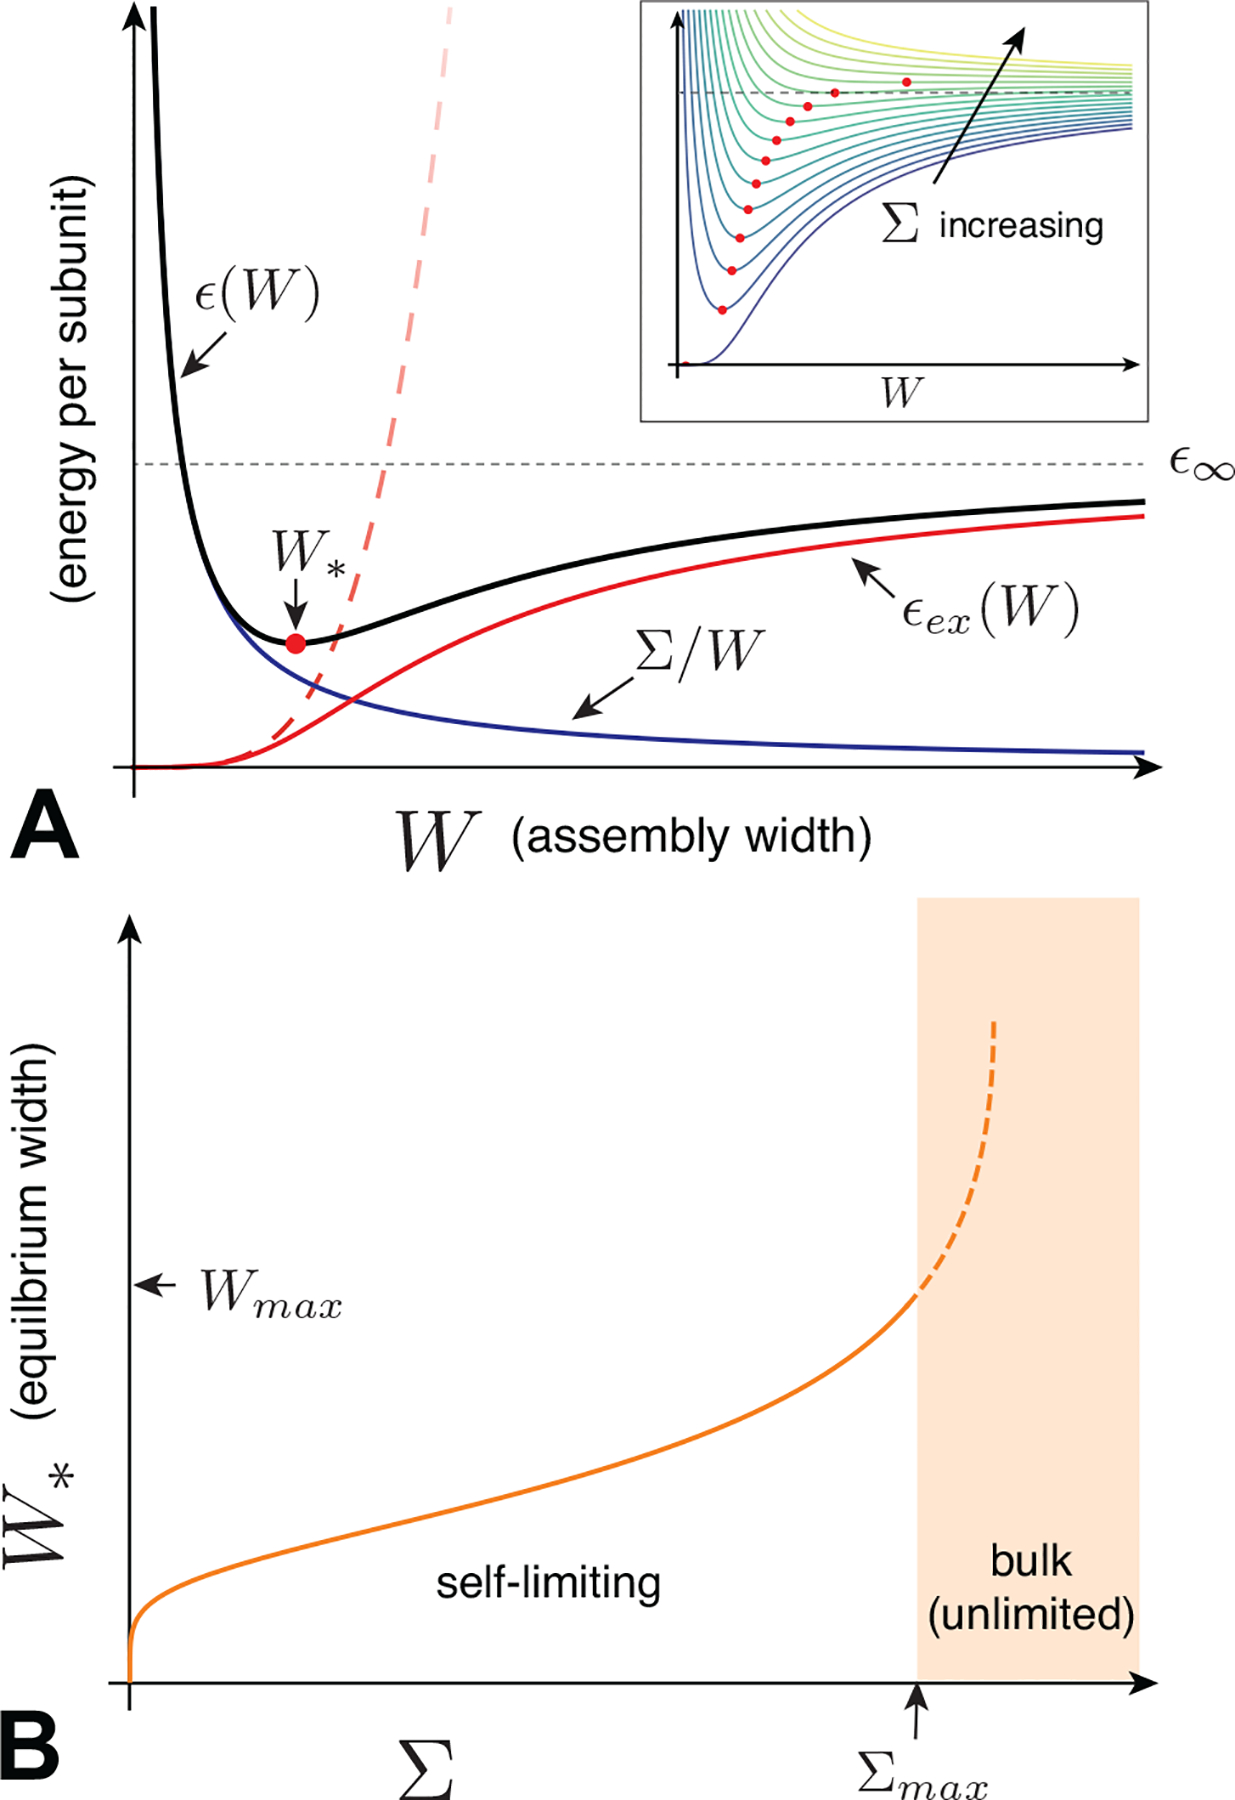
FIG. 13.

(A) A schematic plot of the aggregation energetics (per subunit) for self-limiting open boundary assembly, where the blue, red, and black curves respectively show the surface energy density, excess energy, and total energy density. The dashed curve shows power-law growth of excess energy at small size. The red point highlights the equilibrium self-limiting width W*, and the inset shows the variation of this equilibrium width with increasing surface energy Σ, assuming fixed ϵex(W). (B) A schematic plot of the equilibrium width as a function of Σ, where the dashed portion indicates the possibility of a finite-width branch that is metastable relative to the bulk state W → ∞. The boundary between equilibrium self-limiting and bulk states is marked by a maximum self-limiting size Wmax, denoted as the escape size.
