FIG. 17.

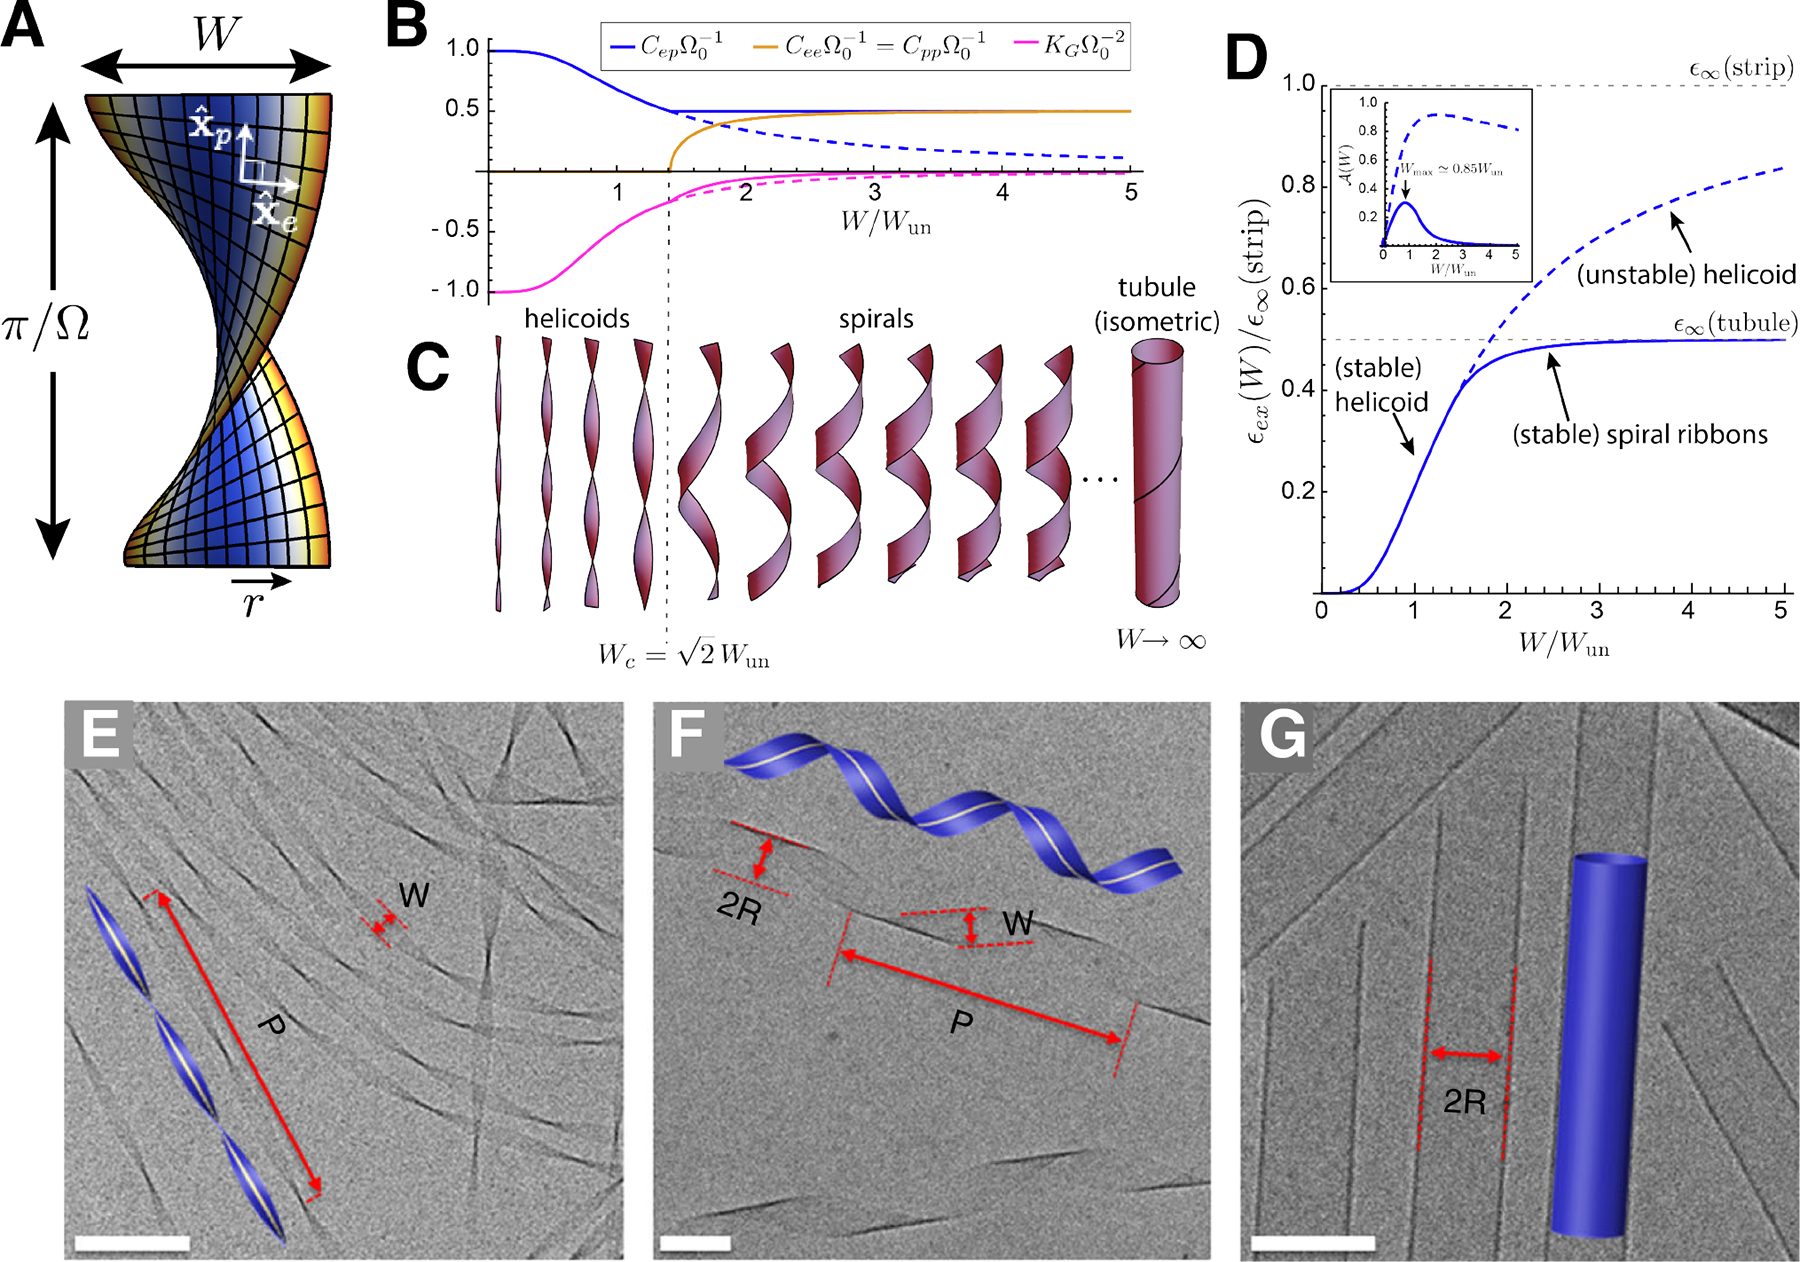
(A) A schematic of a chiral, crystalline ribbon, where colors indicate the local extensional strains required by negative Gaussian curvature, from low (blue) to high (red). (B) Plots of the equilibrium shape relaxation of the narrow ribbon model of (Ghafouri and Bruinsma, 2005) as a function of increasing ribbon width, for curvature components Cij and Gaussian curvature KG, which is approximately uniform over the ribbon. The solid branches show the minimal energy configurations, while the dashed line indicates the (unstable) helicoidal equilibrium. Widths are scaled by the characteristic length Wun, defined in Eq. (63). (C) shows schematics of the shape equilibrium, in particular the shape transition from helicoids to spiral ribbons at a critical width Wc. (D) and (E) plot the respective excess energies for helicoidal (dashed) and helicoid-spiral shape branches (solid). While both shape modes predict an asymptotically relaxed frustration energy and a finite self-limiting width, spiral ribbons expel KG at much faster rate, leading to a narrower range of self-limitation. (E-G) show transmission electron microscopy images of ribbons assembled from chiral bola-amphiphiles adapted from (Zhang et al., 2019). The panels illustrate morphologies evolving with assembly time (scale bars 100 nm): in (E), helicoids are observed after 24 hours; in (F) spiral ribbons are observed after one week; and finally, in (G), closed tubules are observed after 5 months.
