FIG. 19.

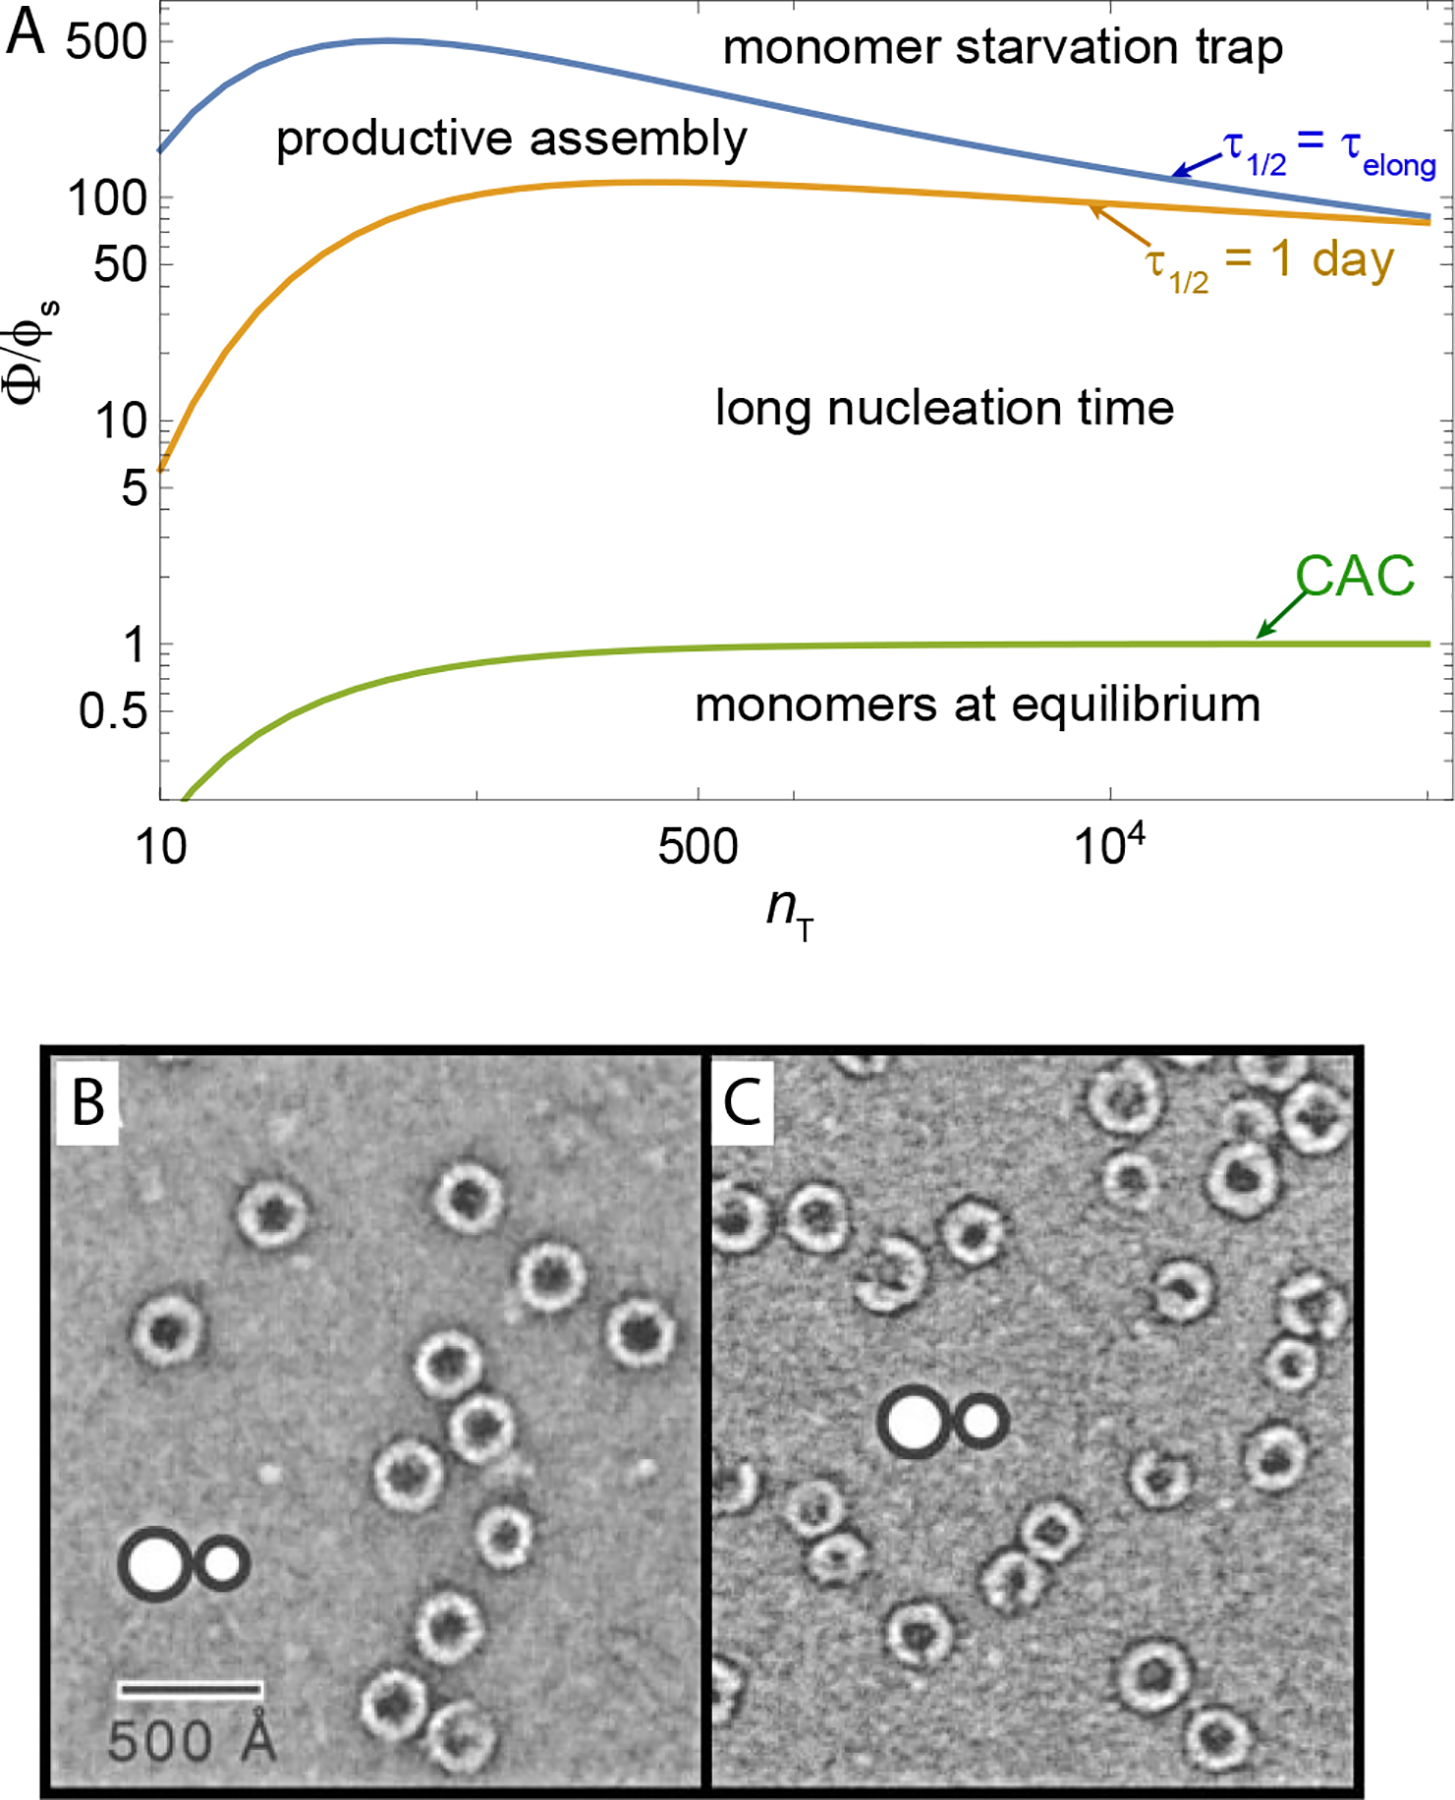
(A) Assembly ‘phase diagram’ for the capsid model (B → ∞ model of the fluid capsule model). The boundaries between the different kinetics regimes discussed in the text are shown as a function of capsid size and supersaturation Φ/Φs = e−βΔμ. The calculation was performed using Eqs. 68, 5, 71 with α = 1, and C2. We set ϵmin = −15kBT and as in Fig. 18. (B), (C) TEM images of in vitro assembly of empty capsids from CCMV capsid proteins. (B) corresponds to productive assembly, while (C) corresponds to assembly of long-lived partial shells (the monomer starvation trap) that occurs under stronger subunit-subunit interactions. Images in (B) and (C) reproduced from (Zlotnick et al., 2000).
