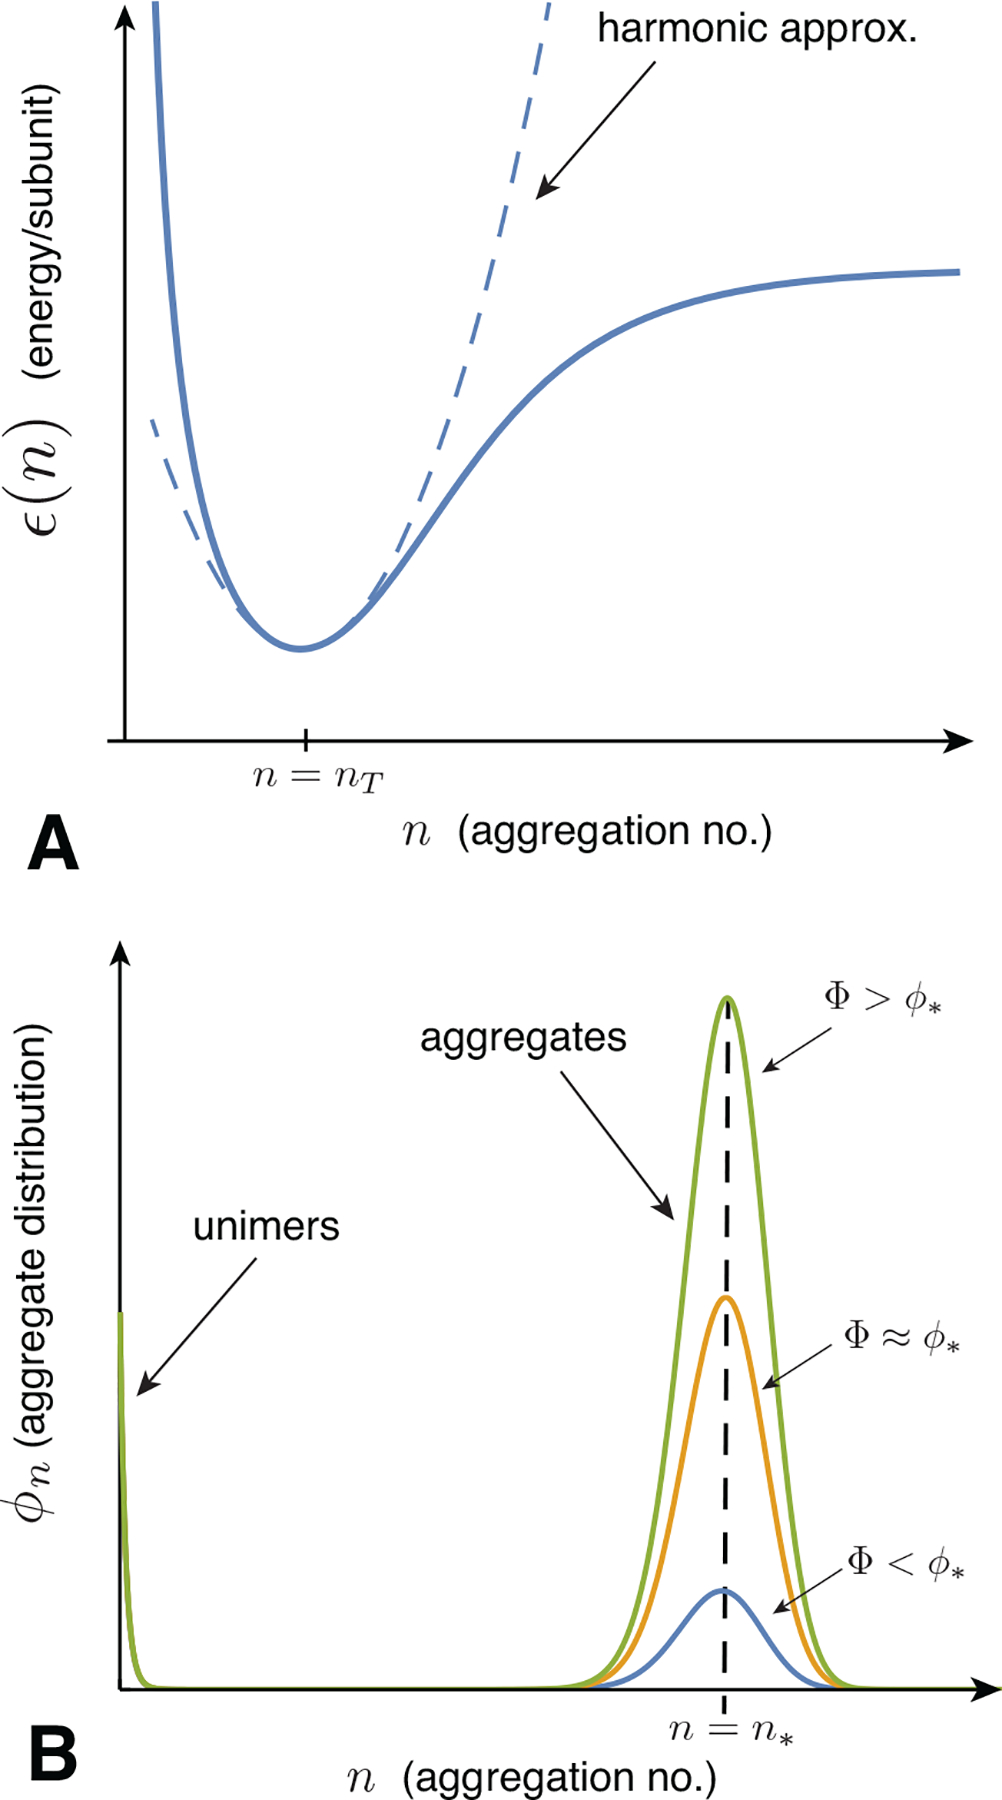
FIG. 4.

(A) A schematic plot of the aggregation (free) energy per subunit is shown as a continuous function of aggregation number n. The dashed line shows a harmonic expansion around a local minimum at the target size n = nT. (B) Schematic plots of the aggregate distribution for a model of the type sketched in (A).
