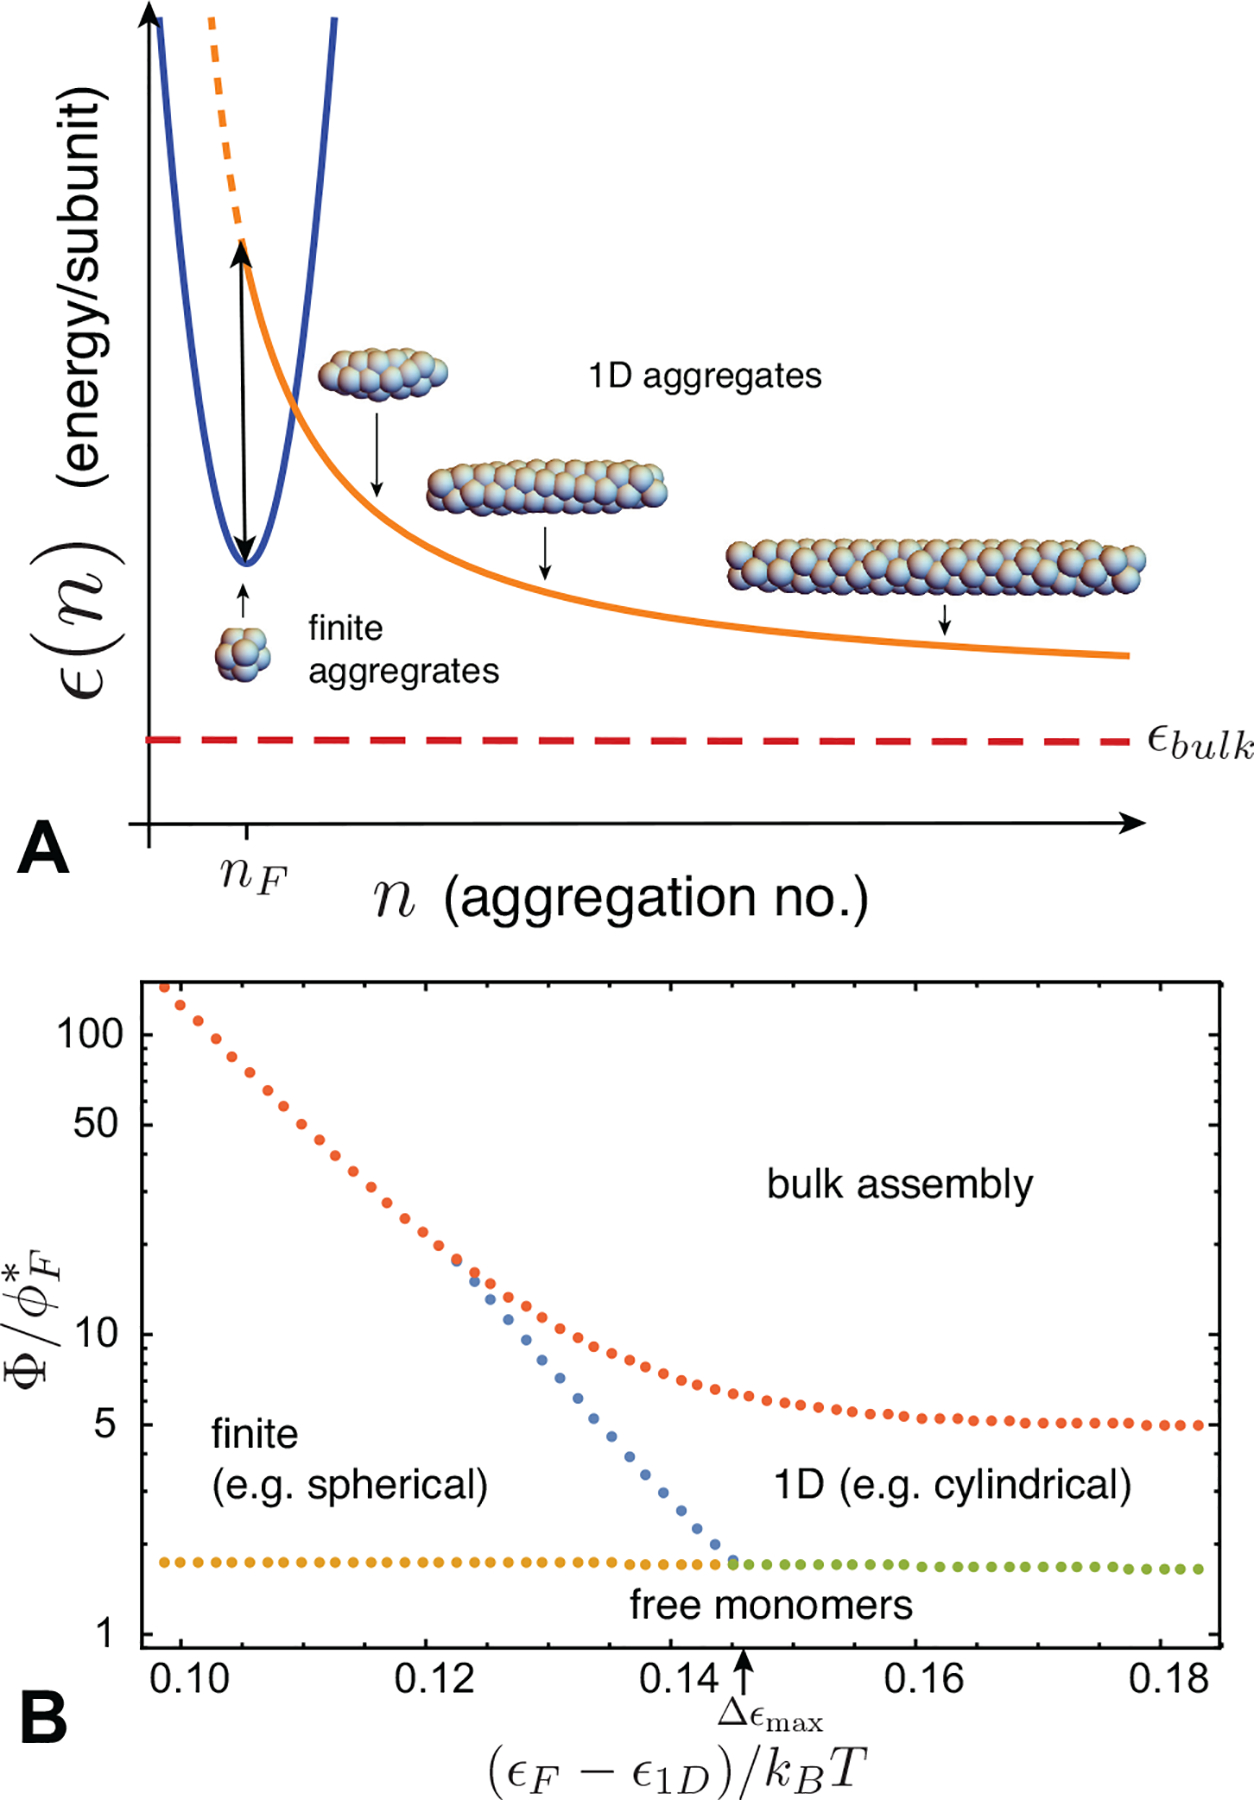
FIG. 7.

(A) A schematic plot of polymorphic aggregation energetics with three competing branches of assembly: finite aggregates (blue) with a local minimum at nF, 1D aggregates (orange), and bulk aggregates (n → ∞ energy shown as red dashed line). In this case, the infinite 1D aggregate has a lower per subunit energy than finite aggregates, and there is a barrier (in total energy) δ that separates these states at n = nF, i.e. the double arrow in (A) corresponds to δ/nF. (B) Phase diagram for concentration-dependent size selection. The dominant aggregation state is shown for a system with coexistence among finite aggregates with nF = 100 subunits, separated by an energy gap ϵF − ϵ1D and a barrier of δ, eq. (34), to 1D aggregates. There is an additional per subunit energy gap of ϵ1D − ϵbulk = 0.0005kBT between 1D and bulk aggregates. The horizontal axis gives the energy gap between spheres and cylinders, and the vertical axis gives the total concentration relative to the CAC for finite aggregates . The boundaries between monomers, finite and 1D aggregates are determined by crossovers in the most populous aggregate type from eq. (30), while the point of bulk saturation is determined by the point when μ = ϵbulk. In this example, the energy per subunit in finite aggregates is fixed at ϵF = −10 kBT and the endcap energy of spherocylinders is Δ0 = 20 kBT. The maximum energy gap for which 2nd CAC behavior occurs (Δϵmax ≈ 0.14 kBT, eq. 35) is indicated on the x-axis.
