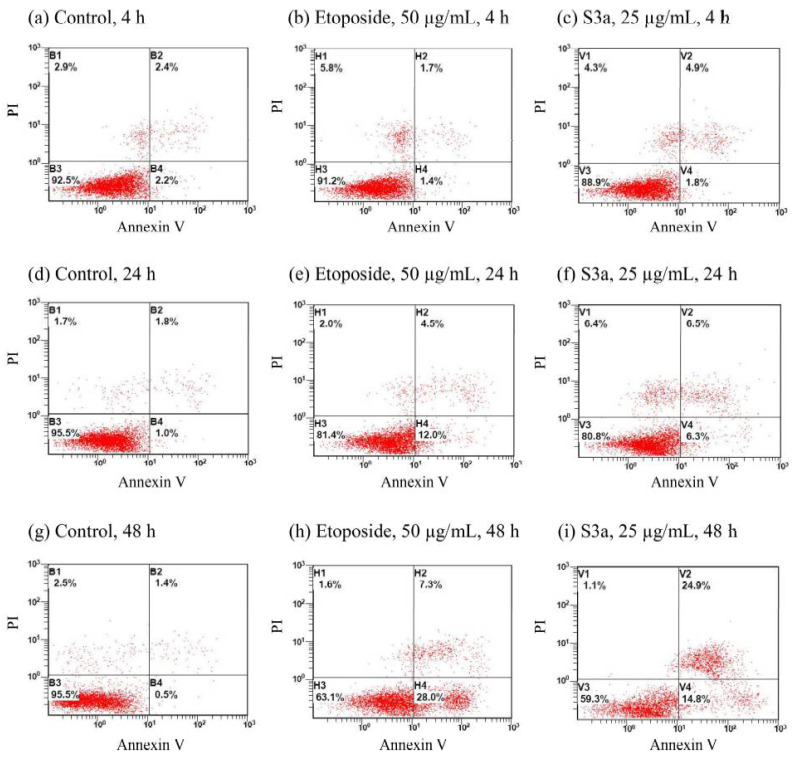
Figure 4.
Apoptosis analysis by Annexin V/PI flow cytometry of treated Hep G2 cells. (a) Control, 4 h; (b) etoposide, 50 µg/mL, 4 h; (c) S3a, 25 µg/mL, 4 h; (d) control, 24 h; (e) etoposide, 50 µg/mL, 24 h; (f) S3a, 25 µg/mL, 24 h; (g) control, 48 h; (h) etoposide, 50 µg/mL, 48 h; (i) S3a, 25 µg/mL, 48 h. S3a: 6,7-dehydroroyleanone.

