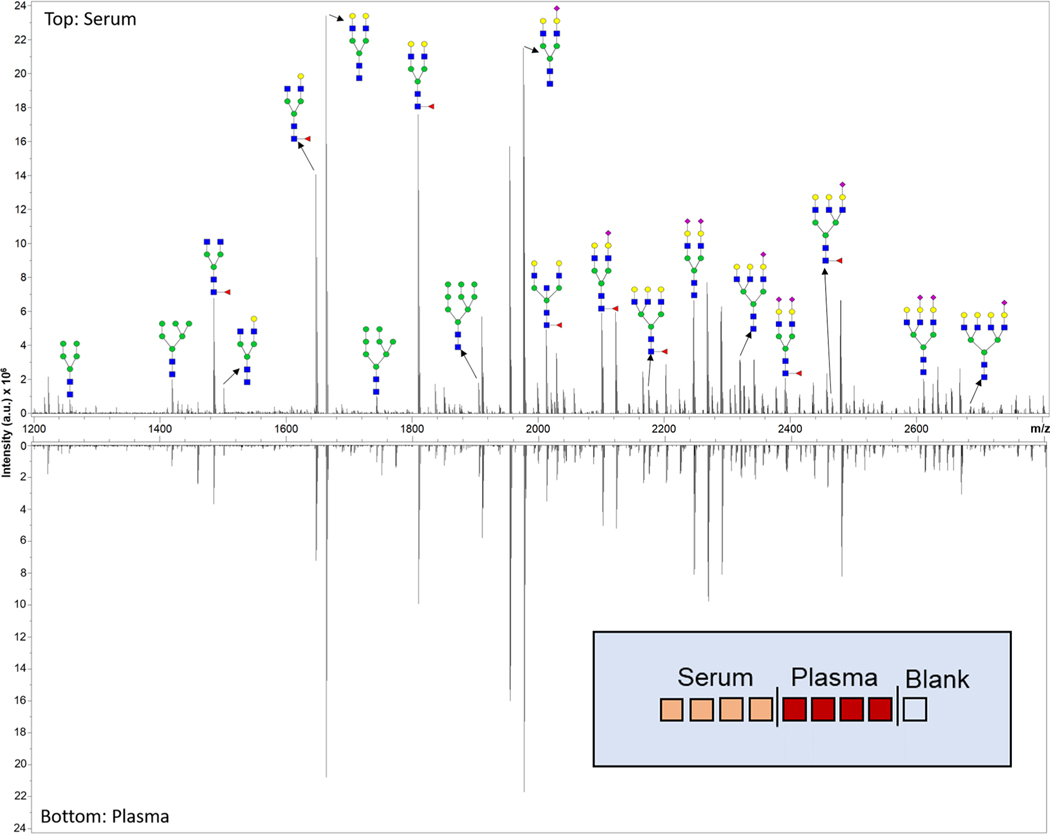
Figure 2.
Representative spectra of a standard serum sample (top) and a standard plasma sample (bottom) analyzed with the N-glycan profiling method by MALDI-FTICR MS. A sample of detected N-glycans are annotated with putative structures. The experimental layout of the slide analyzed is displayed in the bottom right. The N-glycan compositions are represented by blue squares for N-acetylglucosamine, green circles for mannose, yellow circles for galactose, purple diamonds for sialic acid, and red triangles for fucose.

