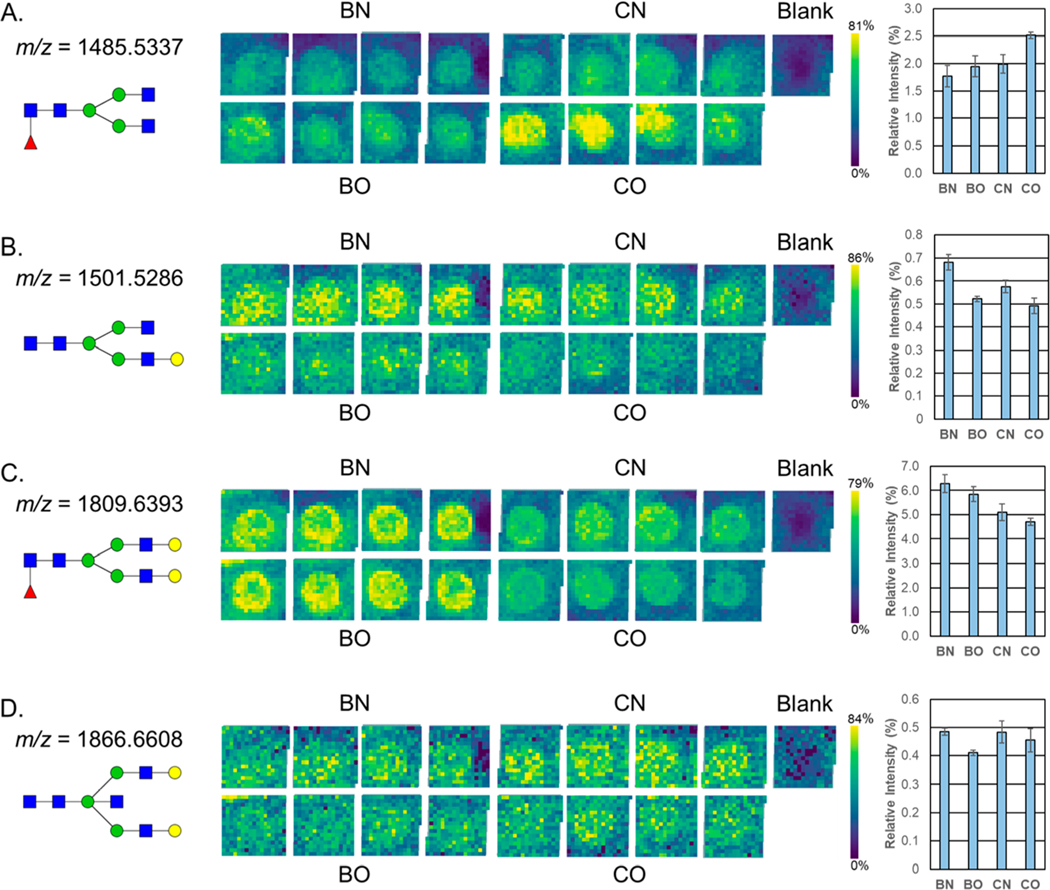
Figure 5.
Application of the workflow to a breast cancer clinical serum set. N-glycan profiles of pooled serum samples from obese and nonobese patients that had a benign lesion or breast cancer were analyzed in quadruplicate by MALDI-FTICR MS. The average relative intensities (normalized to the overall sum of N-glycan intensities) of (A) m/z 1485.5337, (B) m/z 1501.5286, (C) m/z 1809.6393, and (D) m/z 1866.6608 N-glycans are shown as a heat map image array with a color scale optimized for brightness and a bar chart with error bars displaying the standard deviation for the four replicates. The relative intensities of the blank wells were used for background signal subtraction. N-glycan compositions are represented by blue squares for N-acetylglucosamine, green circles for mannose, yellow circles for galactose, purple diamonds for sialic acid, and red triangles for fucose. BN = nonobese patient with a benign lesion, BO = obese patient with a benign lesion, CN = nonobese patient with breast cancer, CO = obese patient with breast cancer.

