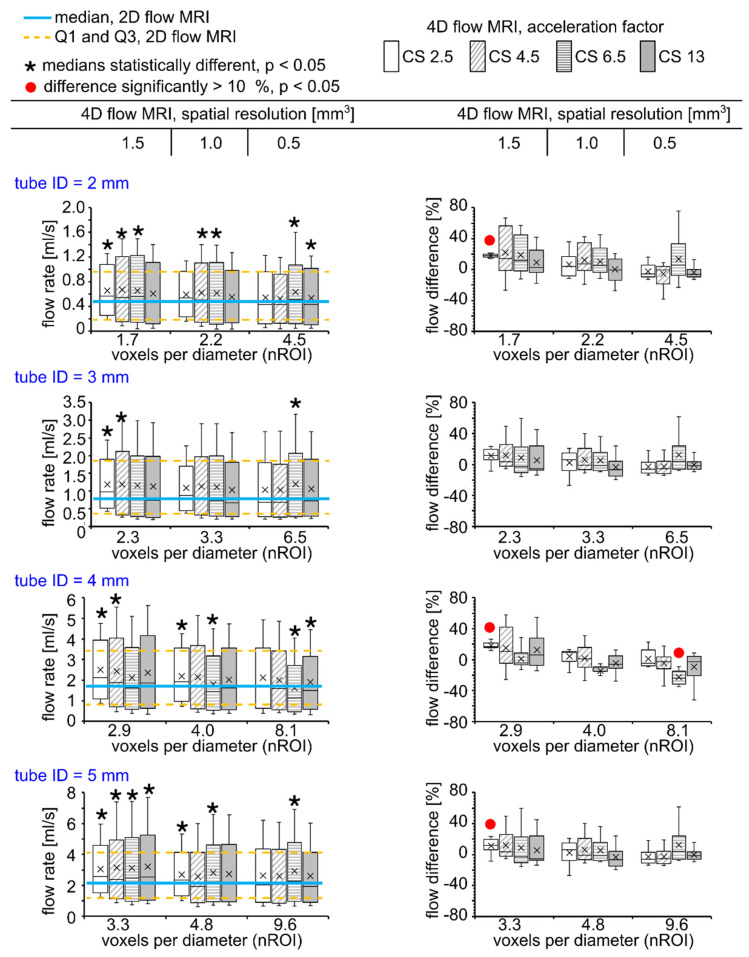
Figure 4.
Box plots representing flow values obtained with 4D flow MRI (left) and flow differences calculated between 4D and 2D flow MRI (right). A voxel size of 1.5 mm3 and CS = 2.5 and 4.5 resulted in statistically different flow median values (p < 0.001, star sign, left, a two-sided paired Wilcoxon signed-rank test). However, the difference was significantly higher than 10% only for four datasets (p < 0.001, red circle, right, a two-sided paired Wilcoxon signed-rank test).

