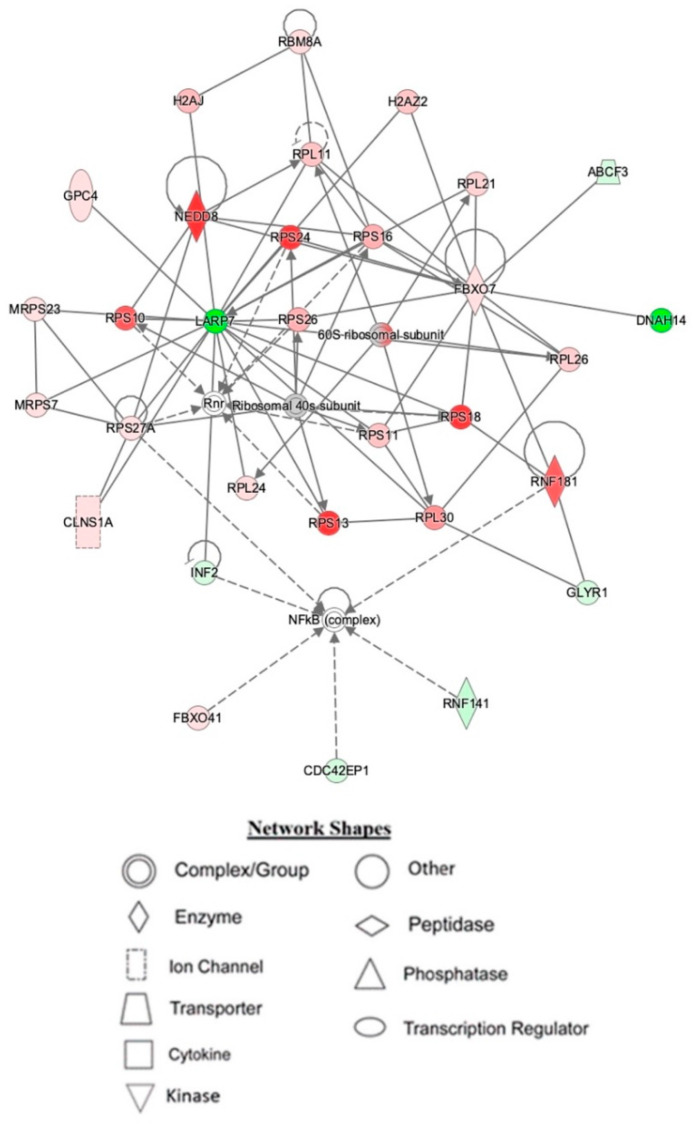
Figure 3.
Depiction of mouse hippocampal network 1, affected by IPA resulting from TAC treatment. Node color is indicative of differential expression. Red represents upregulation, and green represents downregulation. Color intensity directly corresponds to the degree of regulation. Gray nodes represent proteins found in the data set but were not significantly expressed. Uncolored nodes represent proteins not differentially expressed but were incorporated into the computational network based on evidence stored in the Ingenuity Knowledge Base. The arrows and blocked lines indicate known direct and indirect interaction as well as the direction of the interaction.

