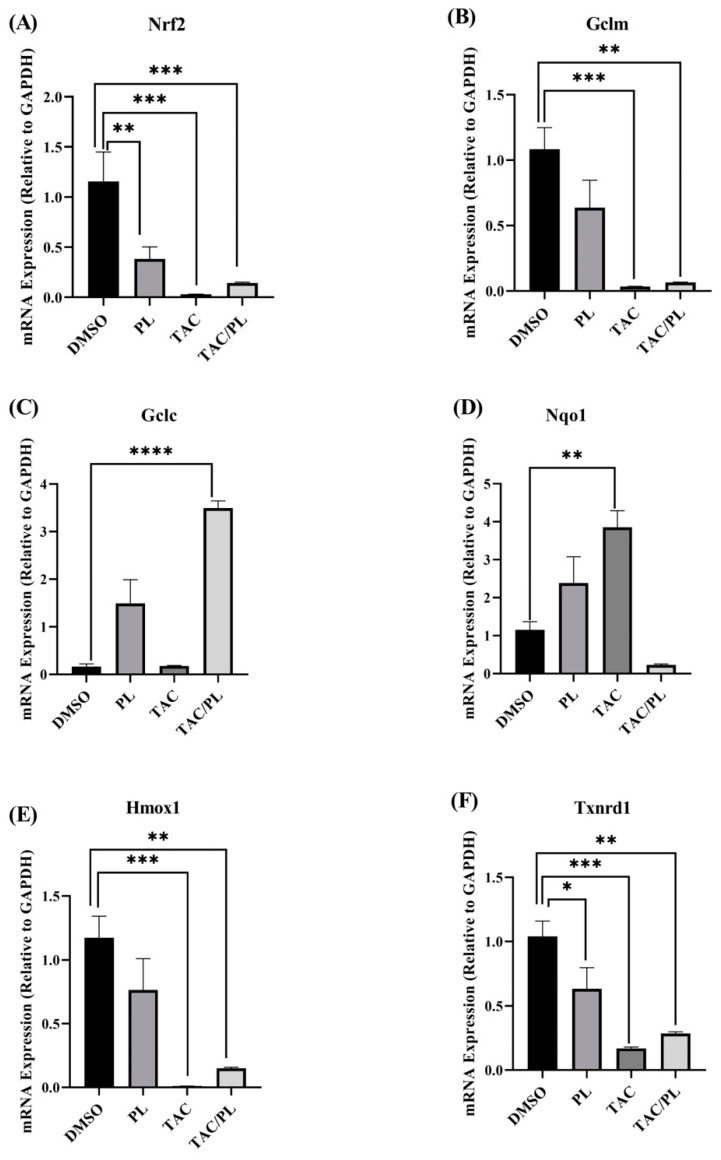
Figure 7.
Changes in mRNA expression of Nrf2 cytoprotective target genes. (A) PL, TAC, and TAC/PL treatments reduced expression of Nrf2. (B) PL, TAC, and TAC/PL treatments reduced expression of GCLM. (C) TAC and TAC/PL treatments increased expression of GCLC. (D) TAC treatment increased expression of Nqo1. (E) TAC and TAC/PL treatments reduced expression of Hmox1. (F) PL, TAC, and TAC/PL treatments reduced expression of Txnrd1. One-way ANOVA, average ± SEM; Bonferroni multiple comparisons * p < 0.05, ** p < 0.01, *** p < 0.001, **** p < 0.0001. DMSO, n = 7; PL, n = 9; TAC, n = 8; TAC/PL, n = 6.

