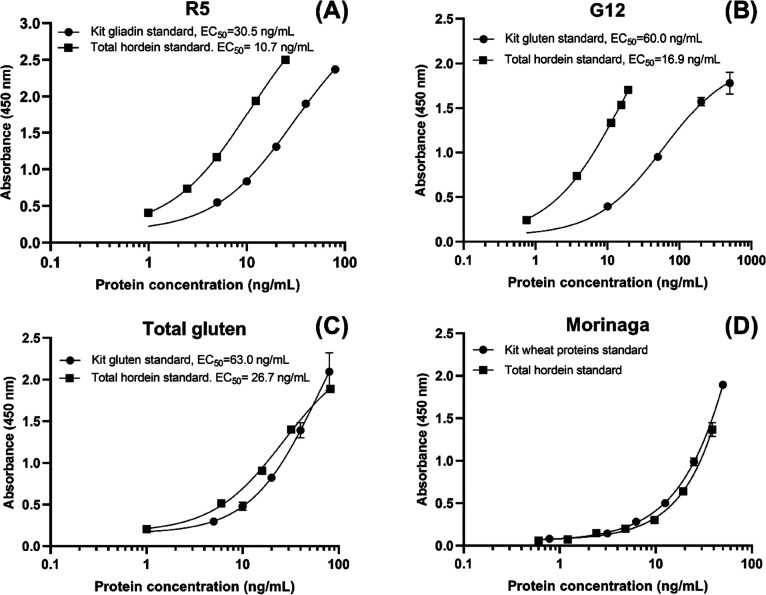
Figure 3.
Comparison of each kit’s own calibration curve and total hordein calibration curve in four ELISA kits: (A) R5 gliadin vs total hordein ng/mL, (B) G12 gluten vs total hordein ng/mL, (C) Total Gluten total gluten vs total hordein, (D) Morinaga wheat proteins vs total hordein ng/mL. The total hordein was hordein isolate × protein content ng/mL. The curves were matched on a gravimetric basis. The curve was produced using agonist response-variable slope (four parameters) nonlinear fit, and the EC50 value was calculated from the best-fit curve values by GraphPad Prism 8.0.2 (San Diego, CA).

