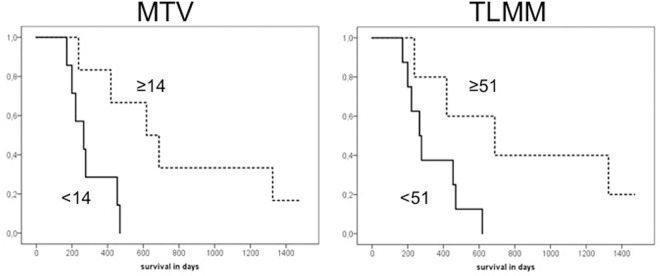
Fig 2. Kaplan-Meier curves for MTV and TLMM.
Survival curves for MTV and TLMM. Dichotomisation of the data based on the median (≥14 for MTV and ≥51 for TLMM). The group with higher values is displayed with the dotted line while the group with lower values is displayed with the bold line. The survival difference between patients with higher and lower values was statistically significant for both MTV (p = 0.014) and TLMM (p = 0.041). Abbreviations: MTV = metabolic tumor volume, TLMM = total lesion methionine metabolism.

