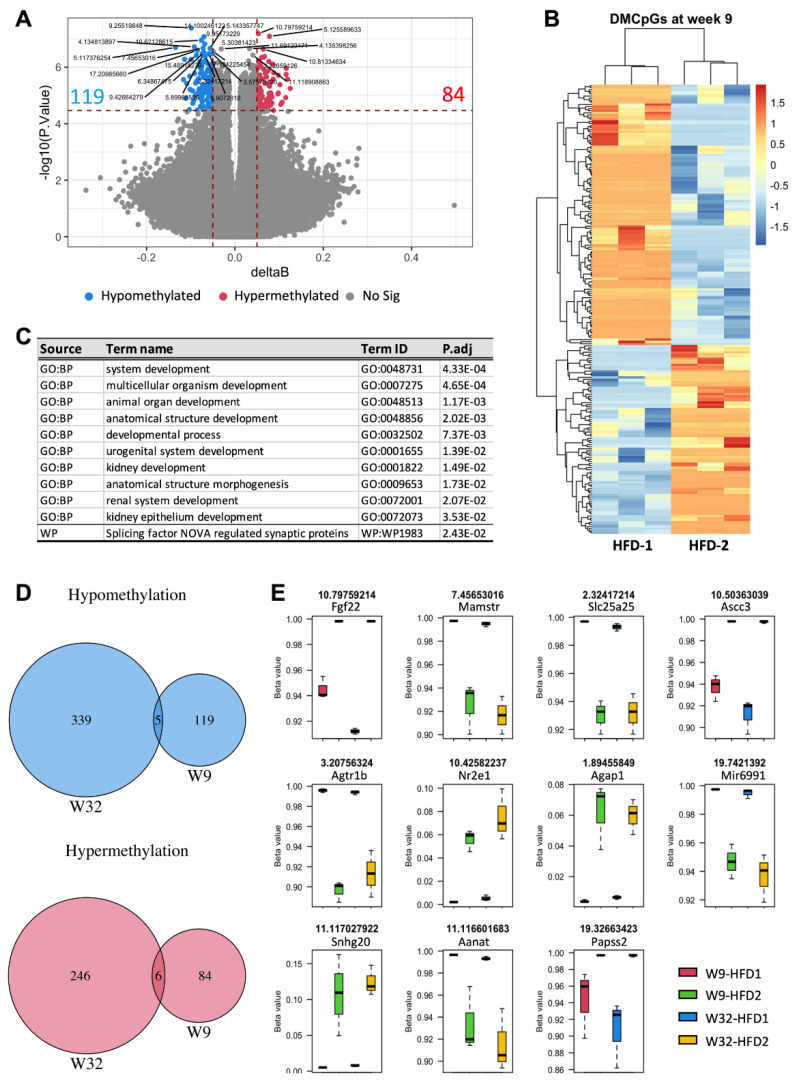
Figure 5.
Comparison of blood DNA methylation profiles at week 9 between HFD-fed mice with advanced and mild DKD by week 32. (A) Volcano plot, (B) Heatmap of differentially methylated CpGs (DMCpGs), (C) Gene set enrichment analysis, (D,E) Common hypomethylated and hypermethylated CpGs in the blood of HFD-2 vs. HFD-1 group at week 9 (W9) and week 32 (W32). GO: Gene annotation, BP: Biological process, WP: Wikipathways. n = 3.

