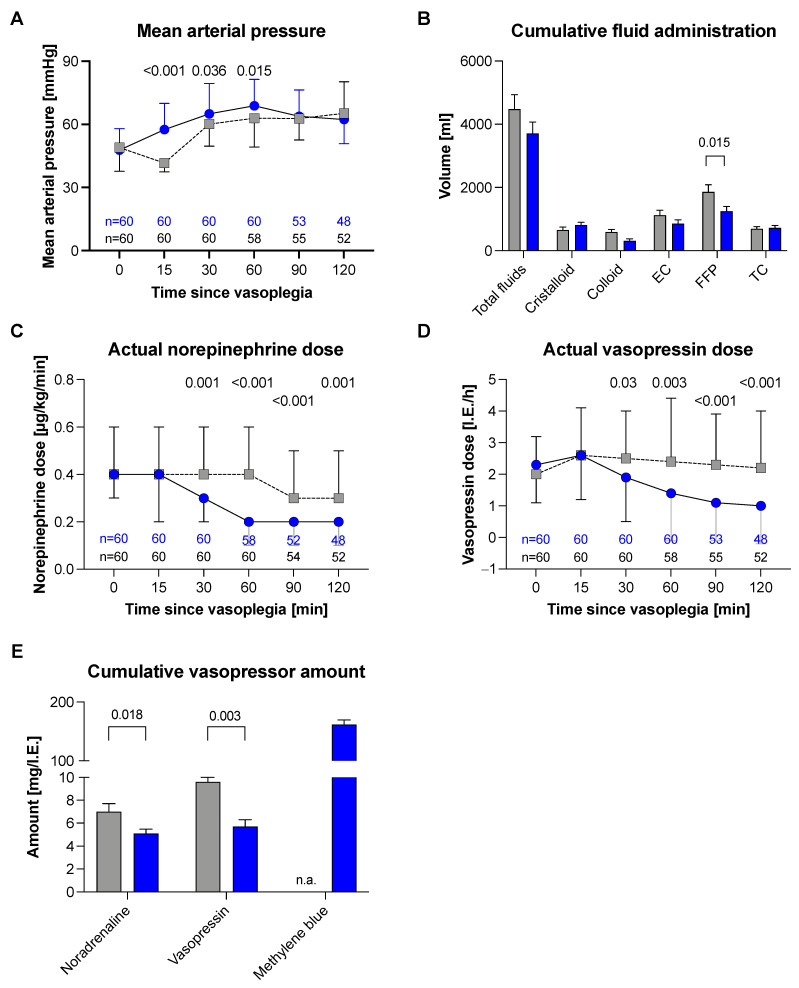
Figure 2.
Effects after methylene blue administration in vasoplegic syndrome: The figures show the median (25th–75th percentile) value in the main study group with regard to the use of methylene blue (blue) versus standard therapy (grey). p-value indicates standard mean (SD). (A) Mean Arterial pressure; (B) Cumulative fluid administration; (C) Actual norepinephrine dose; (D) Actual vasopressin dose; (E) Cumulative vasopressoe amount.

