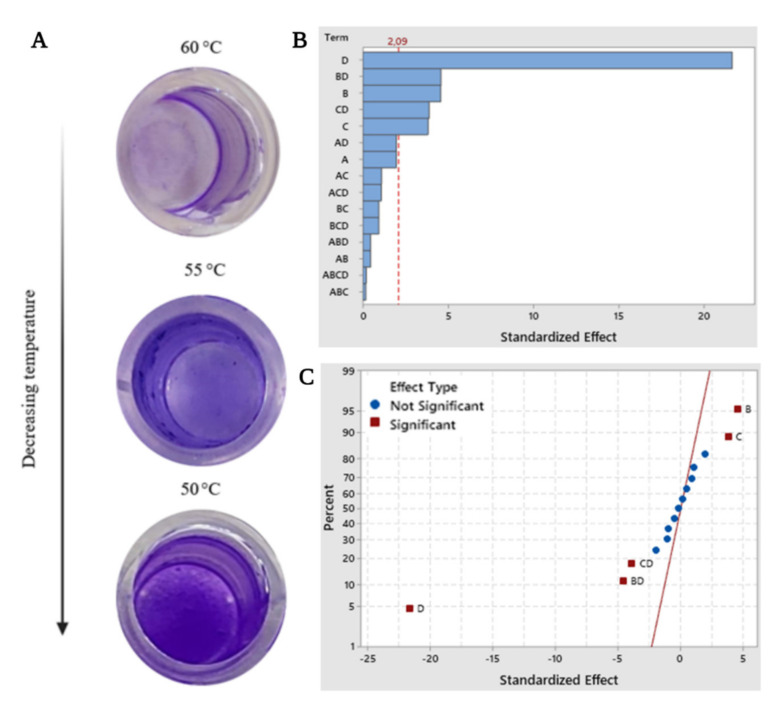
Figure 1.
(A) Biofilm formation in 96-well microtiter plates after 96 h of incubation showing temperature dependence, factorial analysis of biofilm production (A = glucose as carbon source, B = yeast extract as nitrogen source, C = pH, and D = Temperature, with response in biofilm production value α = 0.05); where (B) Pareto chart of the standardized effects, and (C) normal plot of the standardized effects.

