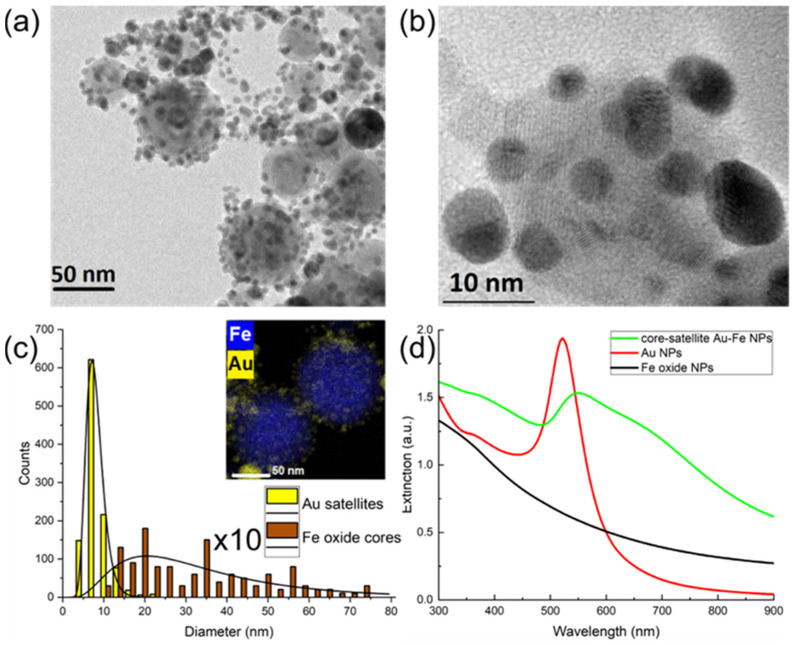
Figure 2.
Characterization of core-satellite Au-Fe NPs. (a) TEM image of the NPs. (b) HR-TEM image of the NPs. (c) Size distribution of Au satellites (yellow) and Fe oxide cores (brown) (note that amount of cores is multiplied by 10). The inset demonstrates elemental mapping (Fe—blue, Au—yellow) of the NPs measured by EDX technique. (d) Optical extinction spectra of Fe oxide NPs (black curve), Au NPs (red curve) and core-satellite Au-Fe NPs (green curve).

