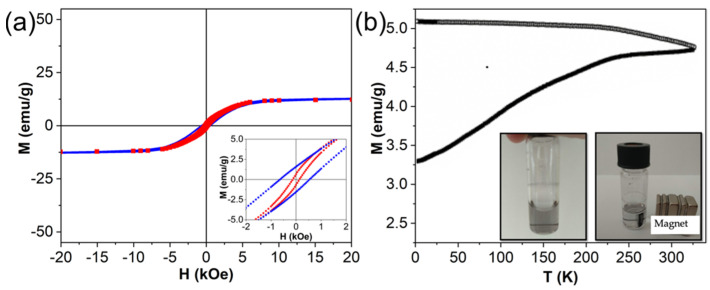
Figure 3.
Magnetic characterization of core-satellite Au-Fe NPs. (a) Magnetic hysteresis loops measured at 5 K (blue) and 300 K (red). The inset is an expanded view of the low-field region; (b) ZFC-FC curves. The inset represents colloidal solutions of the NPs without magnetic field (left) and attracted by the magnet (right).

