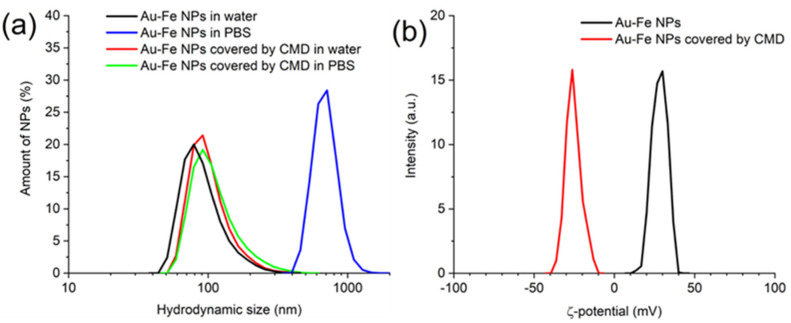
Figure 4.
(a) DLS size histograms of the core-satellite Au-Fe NPs after incubation for 24 h in water and PBS. Black curve—bare NPs incubated in water, blue curve—bare NPs incubated in PBS, red curve—CMD covered NPs incubated in water, green curve—CMD covered NPs incubated in PBS. (b) ζ-potential of bare (black) and CMD covered (red) core-satellite Au-Fe NPs.

